Fig. 1.
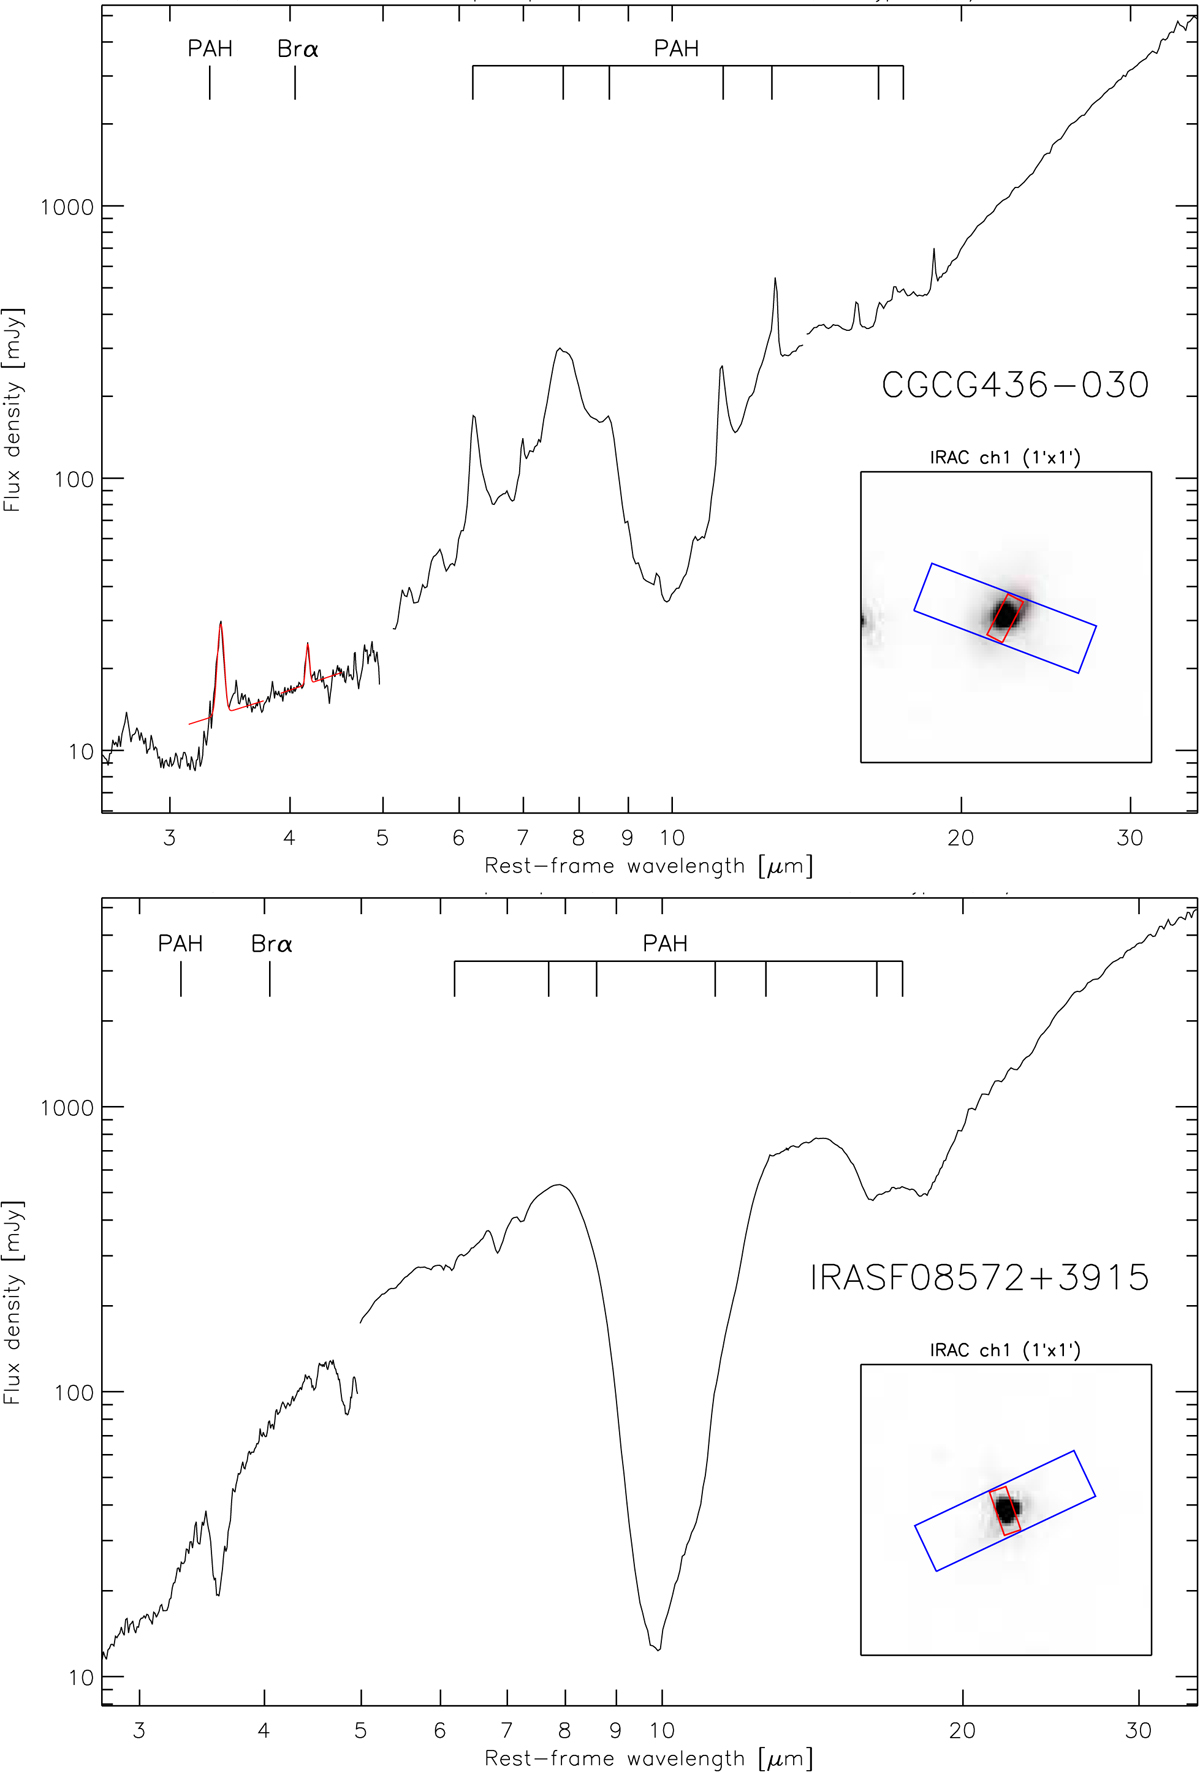
Joined AKARI and Spitzer low-resolution spectra of two typical LIRGs in the sample. The AKARI spectral extraction is performed with the 10.7″ IRS/LL aperture size and the IRS/SL spectra are scaled up to match the LL spectra (see Sect. 3). A starburst-dominated source (CGCG 436-030; top) and an AGN-dominated source (IRAS F08572+3915; bottom) are shown. Their AGN fractions are 8.9 ± 1.8% and 46.6 ± 8.7%, respectively (see Sect. 4.1 and Díaz-Santos et al. 2017). For CGCG 436-030, the fits on the 3.3 μm PAH feature and the Brα line are denoted with red lines. The IRAC 3.6 μm image (1′ × 1′, the same as the AKARI Np FoV size) with the Spitzer IRS SL (red) and LL (blue) apertures overlaid is presented as the inset at the bottom right of each panel. The indicated PAH features in the Spitzer wavelength range are at 6.2, 7.7, 8.6, 11.3, and 12.7 μm in SL, and 16.4 and 17.4 μm in LL.
Current usage metrics show cumulative count of Article Views (full-text article views including HTML views, PDF and ePub downloads, according to the available data) and Abstracts Views on Vision4Press platform.
Data correspond to usage on the plateform after 2015. The current usage metrics is available 48-96 hours after online publication and is updated daily on week days.
Initial download of the metrics may take a while.