Fig. 7.
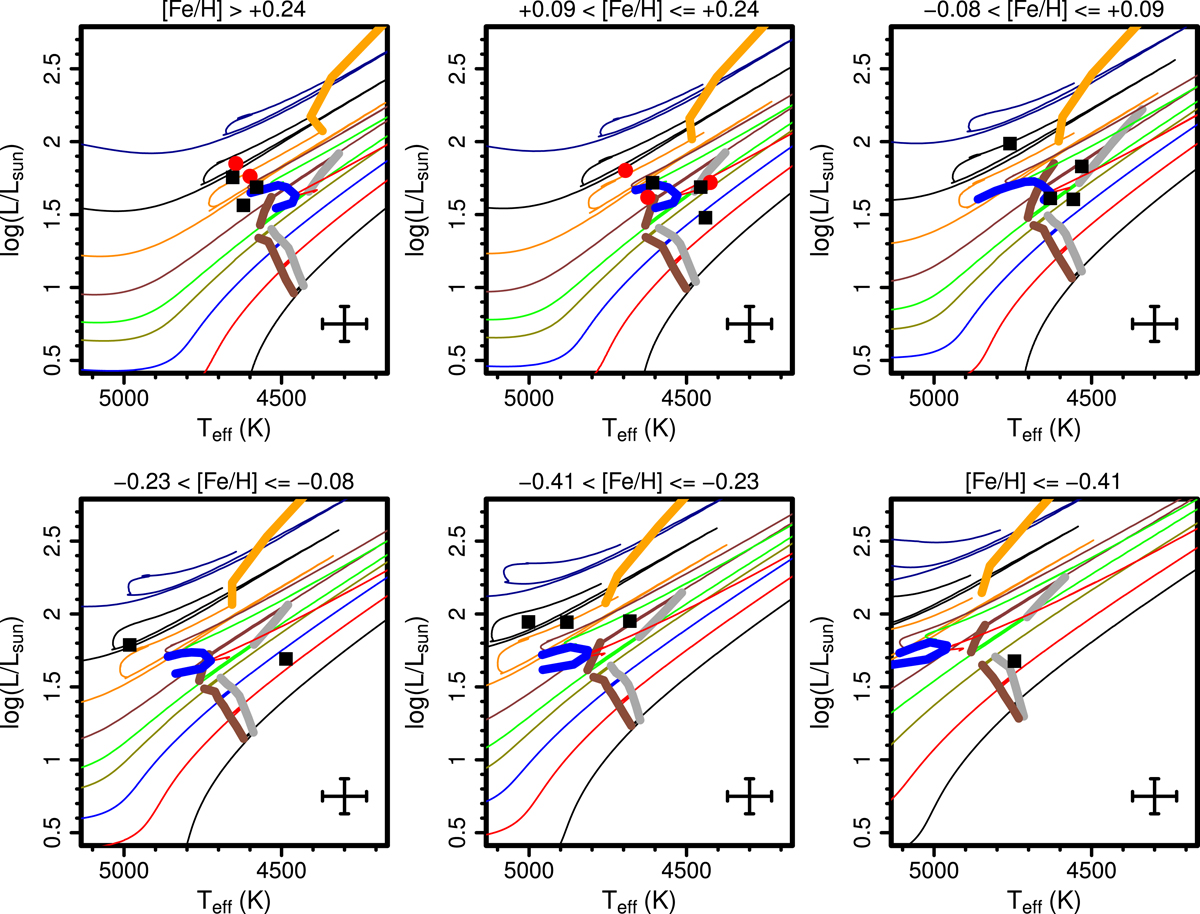
HR diagram with 21 Li-rich giants discovered by the Gaia-ESO Survey that have good values of Gaia parallaxes, divided according to metallicity into different panels. The tracks are the same as in Fig. 2. The range of [Fe/H] is given at the top of each panel. Super Li-rich giants with A(Li) > 3.3 dex (in non-LTE) are shown as red circles, and giants with a Li abundance below this are shown as black squares. Typical error bars, ±70 K in T eff and ±0.12 in log (L/L ⊙), are shown in the bottom right corners of the panels.
Current usage metrics show cumulative count of Article Views (full-text article views including HTML views, PDF and ePub downloads, according to the available data) and Abstracts Views on Vision4Press platform.
Data correspond to usage on the plateform after 2015. The current usage metrics is available 48-96 hours after online publication and is updated daily on week days.
Initial download of the metrics may take a while.