Fig. 4.
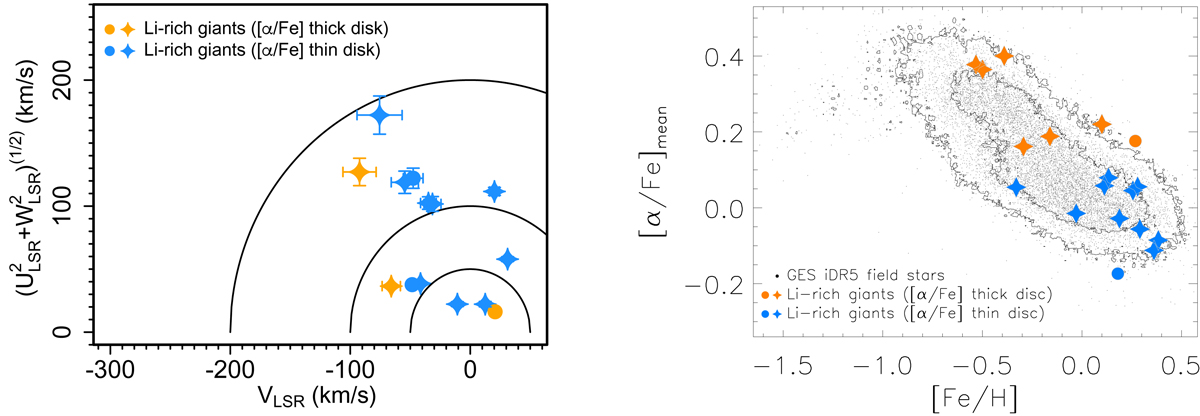
Left: Toomre diagram of the new Li-rich giants with good Gaia DR2 parallaxes (i.e. only the 14 giants with a relative error of the parallax lower than 15%). Error bars are shown, but in many cases they are smaller than the point size. Right: chemical plot of the [α/Fe] ratio as a function of [Fe/H]. In all plots, the field Li-rich giants are displayed as stars and giants in fields of open clusters as solid circles. The colour is orange or blue for stars that are tentatively associated with the thick or thin disc, respectively. Other Gaia-ESO iDR5 field stars are shown as dots in the right panel.
Current usage metrics show cumulative count of Article Views (full-text article views including HTML views, PDF and ePub downloads, according to the available data) and Abstracts Views on Vision4Press platform.
Data correspond to usage on the plateform after 2015. The current usage metrics is available 48-96 hours after online publication and is updated daily on week days.
Initial download of the metrics may take a while.