Fig. 5
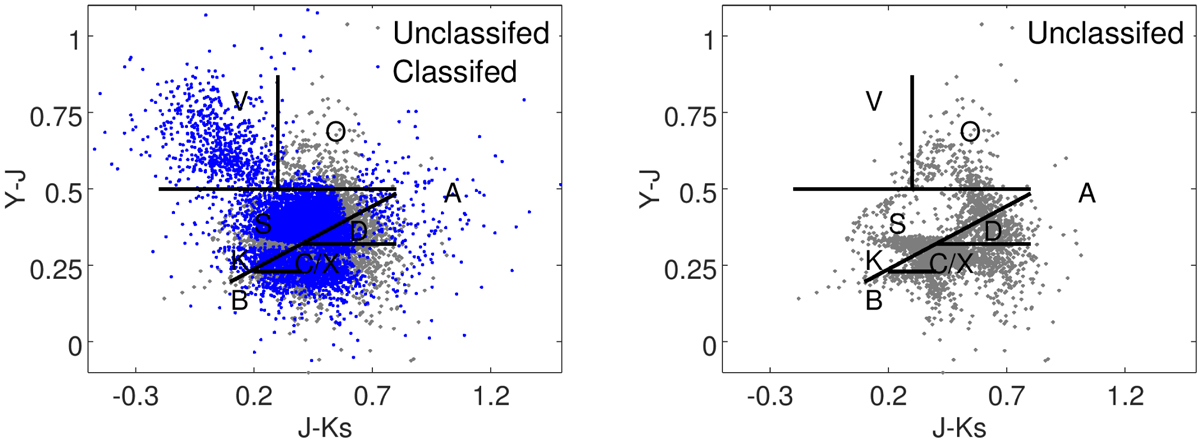
Distribution of asteroids in the (Y − J) vs. (J − Ks) plot for asteroids with (Y − J)err ≤ 0.118 and (J − Ks)err ≤ 0.136 (asteroids with errors in Q2 limits). Left panel: the objects for which a final taxonomic class was assigned are shown in blue, while those for which the two algorithms gave a different solution are shown in gray. Right panel: for clarity, the unclassified asteroids are shown as a separate figure.
Current usage metrics show cumulative count of Article Views (full-text article views including HTML views, PDF and ePub downloads, according to the available data) and Abstracts Views on Vision4Press platform.
Data correspond to usage on the plateform after 2015. The current usage metrics is available 48-96 hours after online publication and is updated daily on week days.
Initial download of the metrics may take a while.