Free Access
Fig. 3
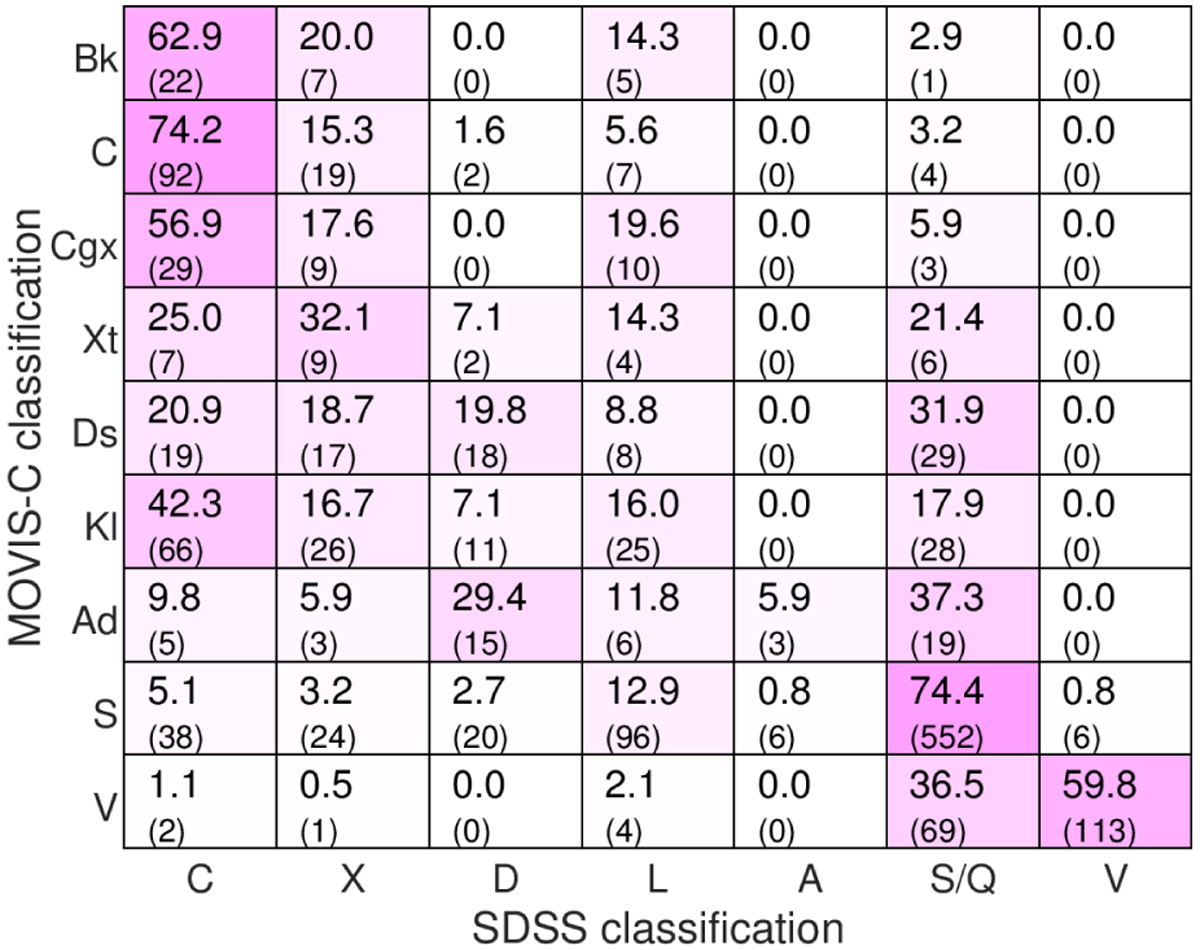
Cross-tabulation matrix between the classification obtained based on MOVIS-C data (this work) and that obtained from SDSS data (Carvano et al. 2010). The percentages are specified relative to MOVIS-C assigned type, and the number of objects is specified within parenthesis. The color intensity outlines the interferences.
Current usage metrics show cumulative count of Article Views (full-text article views including HTML views, PDF and ePub downloads, according to the available data) and Abstracts Views on Vision4Press platform.
Data correspond to usage on the plateform after 2015. The current usage metrics is available 48-96 hours after online publication and is updated daily on week days.
Initial download of the metrics may take a while.