Fig. 2
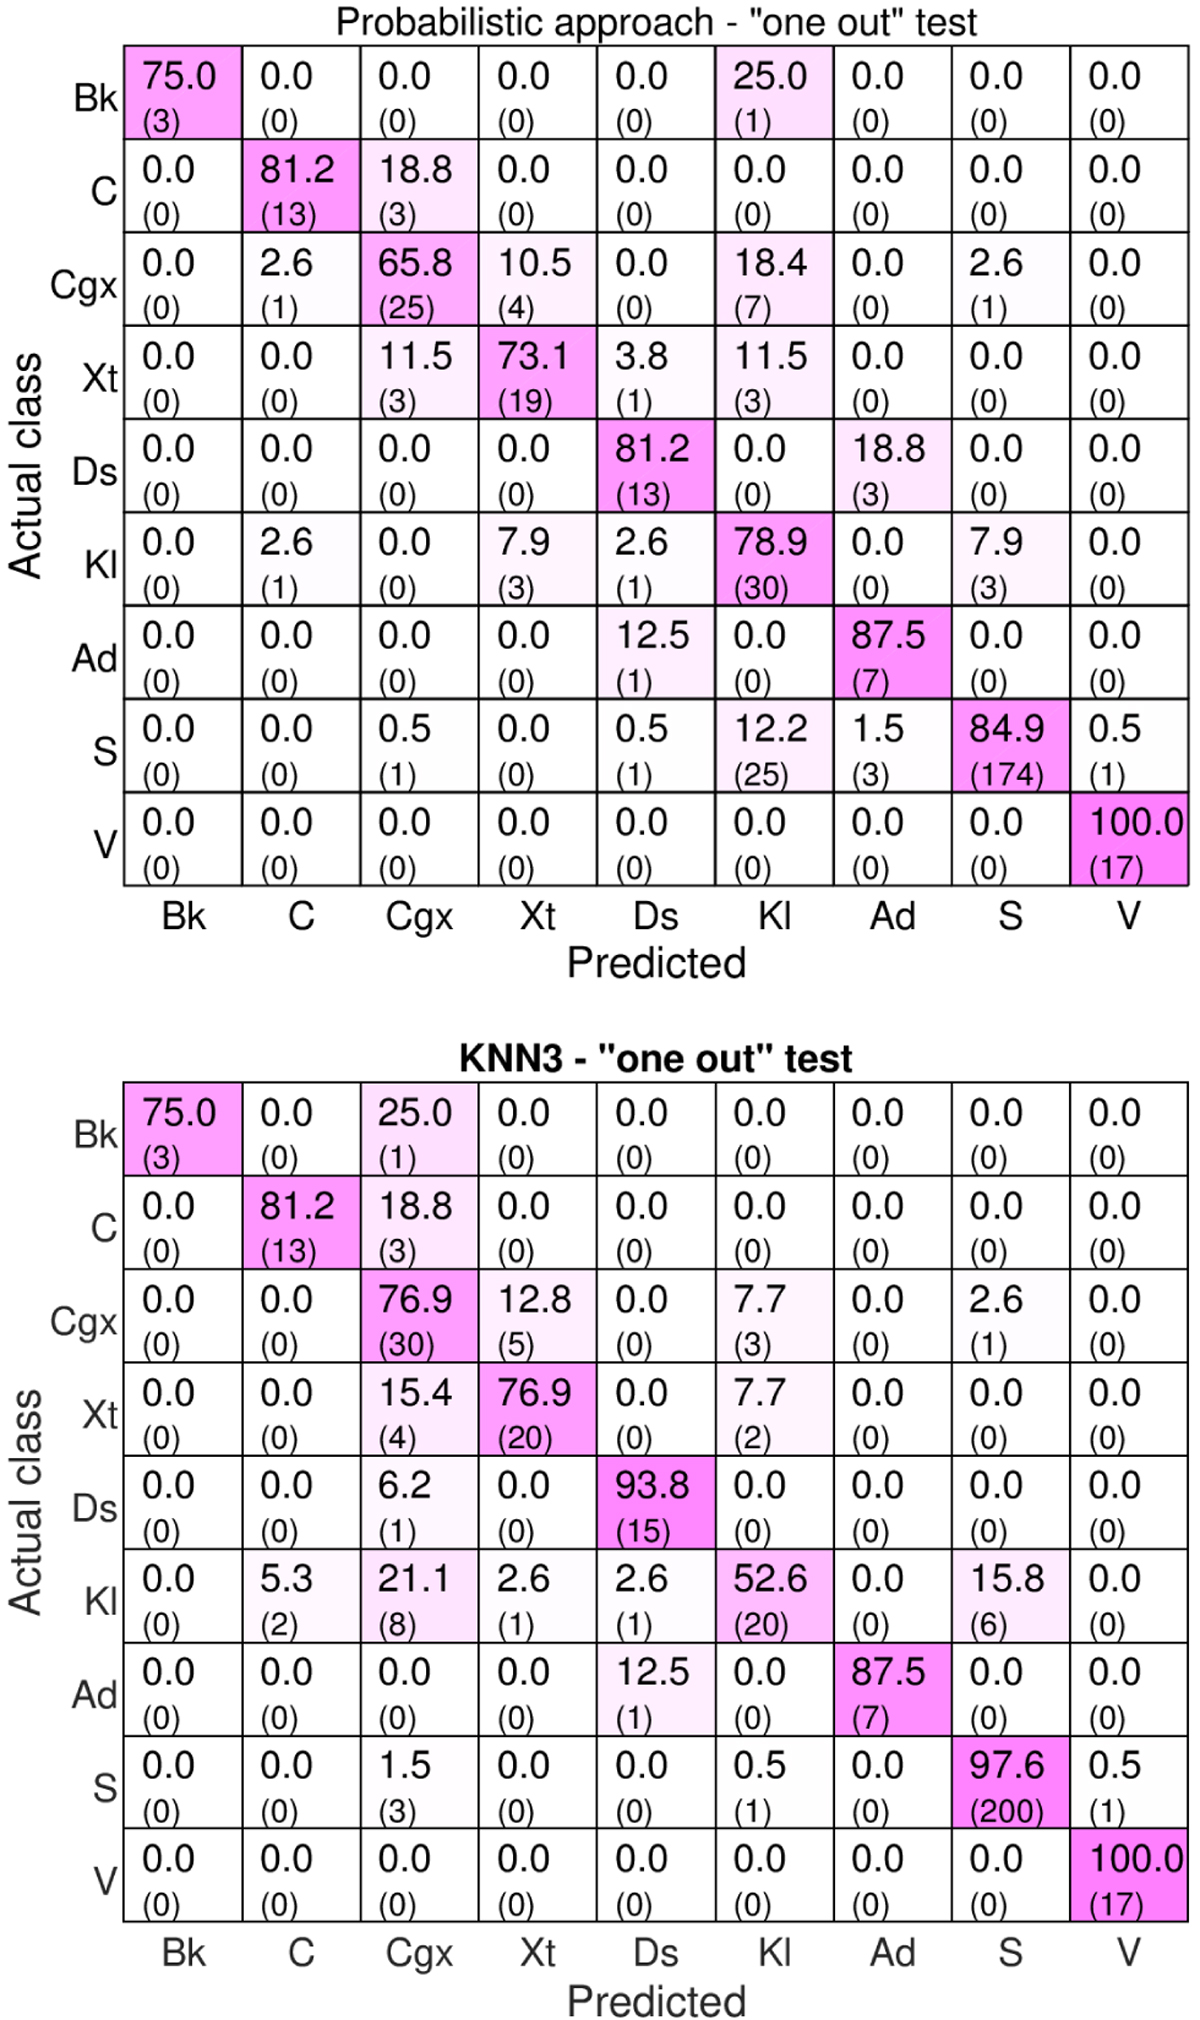
Confusion matrix for the algorithms obtained after the leave-one-out cross-validation. It shows the classes predicted by the algorithm based on their computed colors vs. the spectral classification (labeled actual class) for the 371 samples of the reference set. The top panel shows the results for the probabilistic approach and the bottom panel shows the results for the k = 3 nearest neighbors (kNN3) algorithm. Each row of the matrix represents the instances (in terms of percentages computed relative to the total number of objects for the given spectral class) in the actual spectral class, while each column represents the instances in the class predicted by the algorithm (the number of instances is given within the parenthesis). The color intensity outlines the interferences.
Current usage metrics show cumulative count of Article Views (full-text article views including HTML views, PDF and ePub downloads, according to the available data) and Abstracts Views on Vision4Press platform.
Data correspond to usage on the plateform after 2015. The current usage metrics is available 48-96 hours after online publication and is updated daily on week days.
Initial download of the metrics may take a while.