Free Access
Fig. A.2
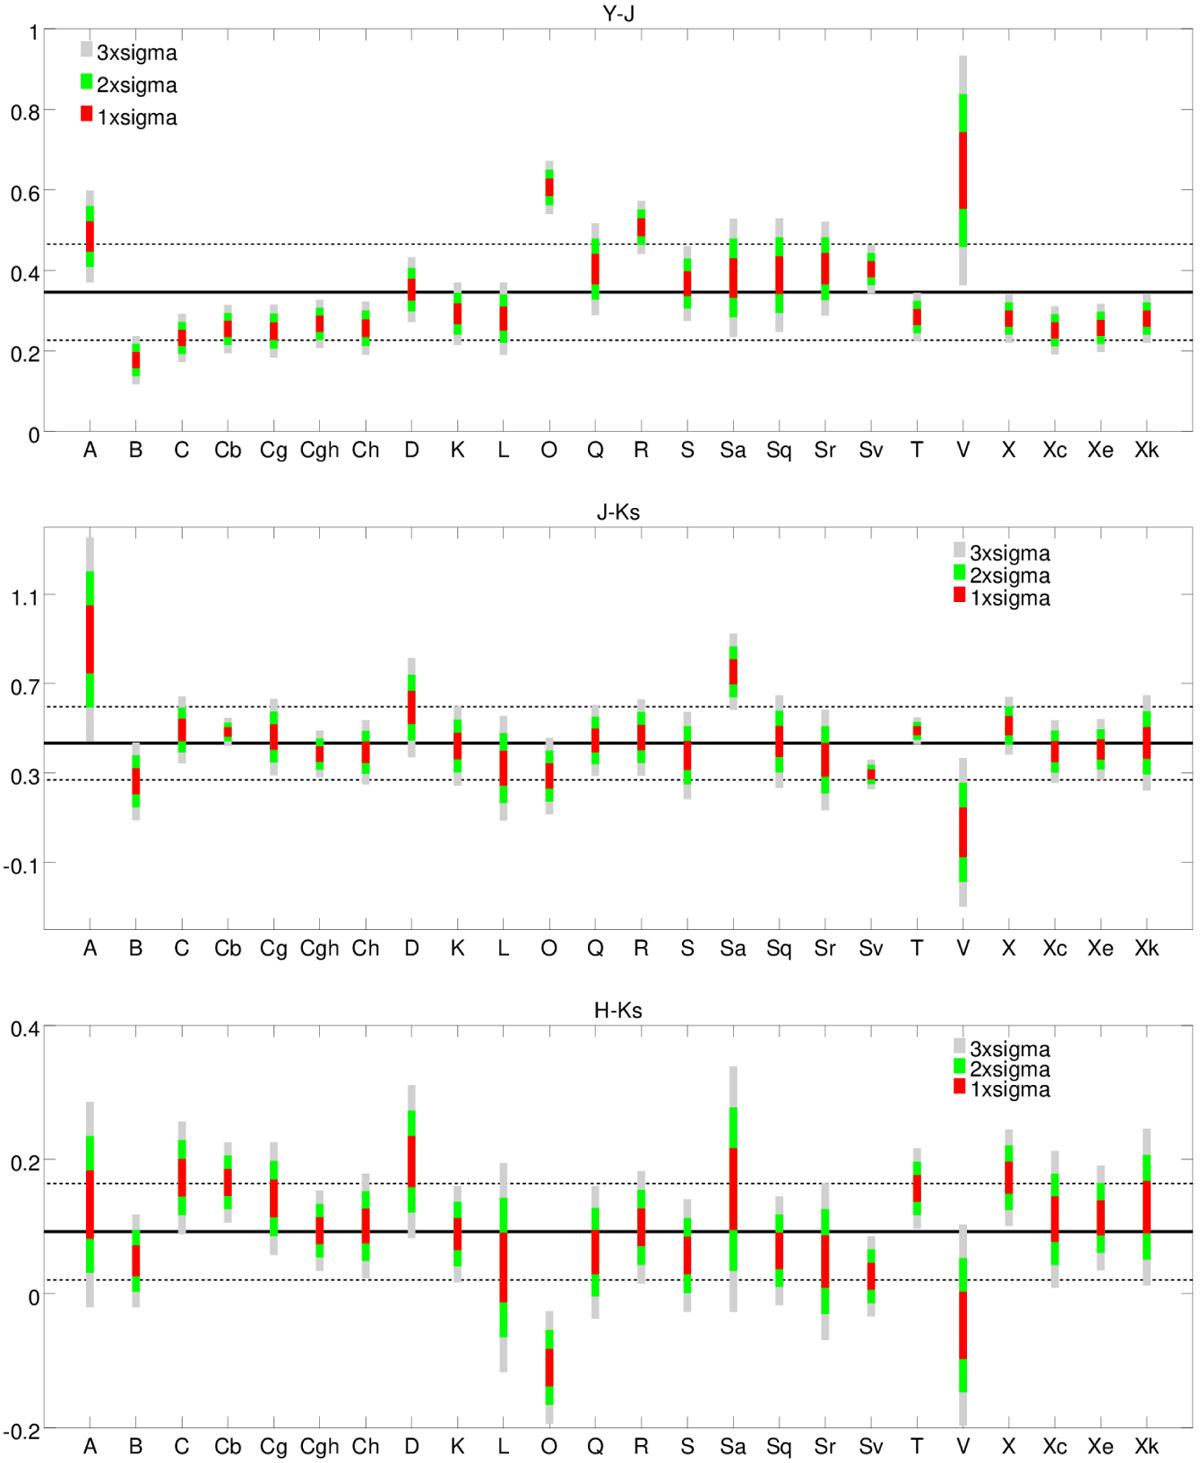
Average colors and standard deviations of Bus-DeMeo types computed from the 371 spectra from which the taxonomy was built. Red bars show the [–σ, +σ] interval, green bars show [–2σ, +2σ], and gray bars show [–3σ, +3σ]. The solid and dotted horizontal line represents the mean and the standard deviation of the entire set.
Current usage metrics show cumulative count of Article Views (full-text article views including HTML views, PDF and ePub downloads, according to the available data) and Abstracts Views on Vision4Press platform.
Data correspond to usage on the plateform after 2015. The current usage metrics is available 48-96 hours after online publication and is updated daily on week days.
Initial download of the metrics may take a while.