Fig. 5
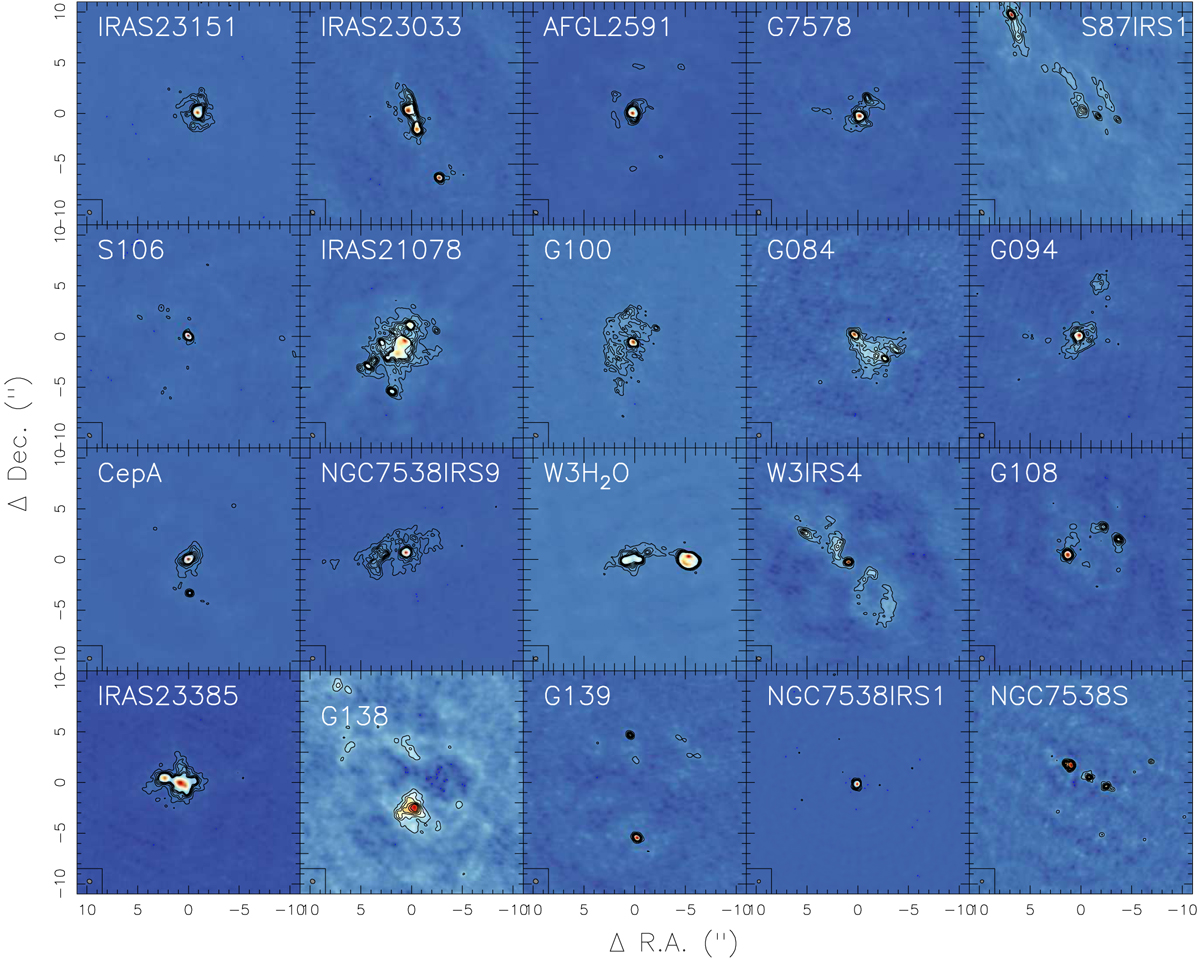
Compilation of 1.37 mm continuum images for CORE sample on the same angular scale. The contouring is in 5σ steps (see Table 3). The sources are labeled in each panel, and the synthesized beams are shown at the bottom-left of each panel. A comparison figure converted to linear scales is shown in Fig. 6. Magnifications and absolute flux-scales are shown in Appendix C.
Current usage metrics show cumulative count of Article Views (full-text article views including HTML views, PDF and ePub downloads, according to the available data) and Abstracts Views on Vision4Press platform.
Data correspond to usage on the plateform after 2015. The current usage metrics is available 48-96 hours after online publication and is updated daily on week days.
Initial download of the metrics may take a while.