Fig. 2
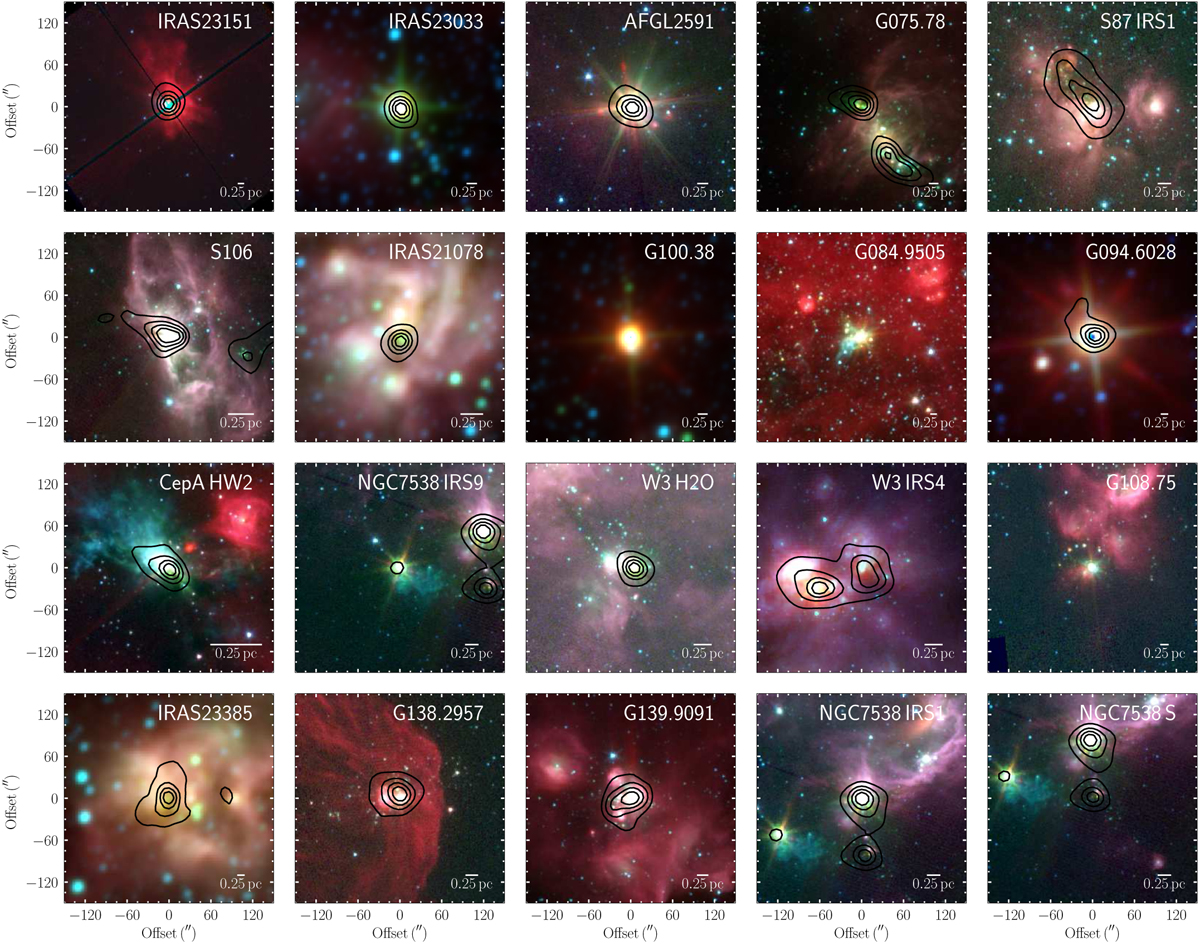
Large-scale overview images for the whole CORE sample. The color scale shows three-color images with blue, green, and red from Spitzer 3.6, 4.5, and 8.0 μm for all sources except IRAS 23033, IRAS21078, G100, G094, and IRAS 23385 for which WISE 3.4, 4.6, and 12 μm data are presented. Furthermore, W3IRS4 uses Spitzer 3.6, 4.5 μm, and MSX 8 μm. The contours show SCUBA 850 μm continuum data (di Francesco et al. 2007; contour levels 20%, 40%, 60%, and 80% of the peak emission) for all sources except G100, G084, and G108 where these data do not exist.
Current usage metrics show cumulative count of Article Views (full-text article views including HTML views, PDF and ePub downloads, according to the available data) and Abstracts Views on Vision4Press platform.
Data correspond to usage on the plateform after 2015. The current usage metrics is available 48-96 hours after online publication and is updated daily on week days.
Initial download of the metrics may take a while.