Fig. 9
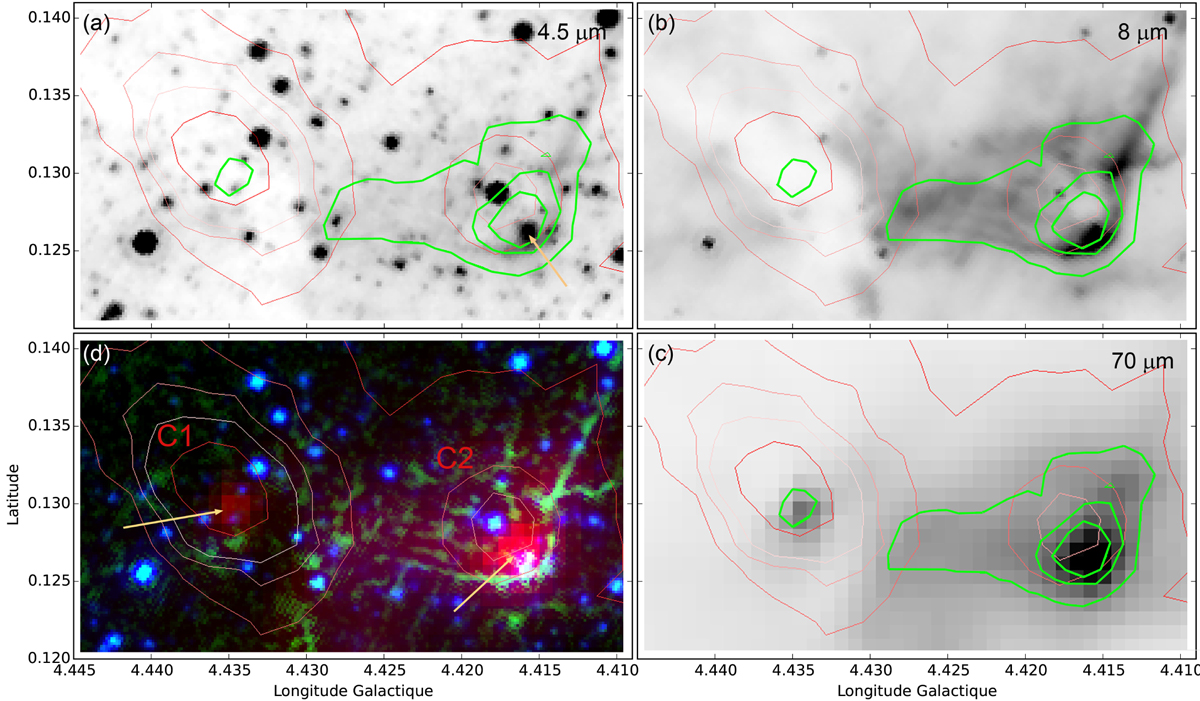
Star formation in two clumps located at the waist of G004.40+00.11. The stellar content of the clumps is shown by 4.5 μm (panel a), 8.0 μm (panel b), and 70 μm (panel c) images. The over-plotted red contours are of column density (levels of 1.5, 1.0, 0.75, 0.5, 0.25 × 1023 cm−2) and the green contours are of 70 μm emission (levels of 20 000, 15 000, 10 000 MJy sr−1). Panel d: composite colour image with 70 μm emission in red, an unsharp image of the 8.0 μm emission highlighting the bright rim bordering clump C2 in green, and 4.5 μm emission in blue. The orange arrows point to the two YSOs emitting at 70 μm. The green contours are of 70 μm emission.
Current usage metrics show cumulative count of Article Views (full-text article views including HTML views, PDF and ePub downloads, according to the available data) and Abstracts Views on Vision4Press platform.
Data correspond to usage on the plateform after 2015. The current usage metrics is available 48-96 hours after online publication and is updated daily on week days.
Initial download of the metrics may take a while.