Open Access
Fig. 8
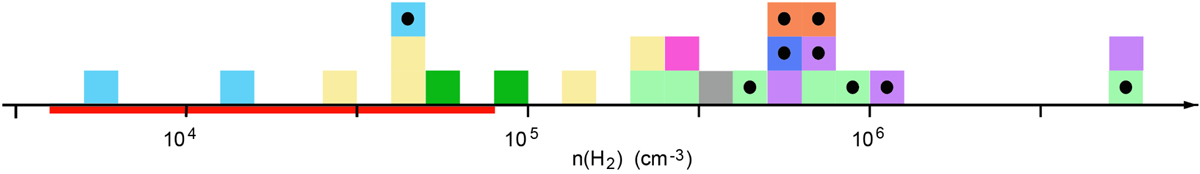
Mean volume density of the clumps associated with bipolar nebulae, observed either around their waists or along the parental filaments. The black circles indicate clumps containing a source more luminous than 1000L⊙. The red lineon the low-density side indicates the range of densities estimated for the parental structures.
Current usage metrics show cumulative count of Article Views (full-text article views including HTML views, PDF and ePub downloads, according to the available data) and Abstracts Views on Vision4Press platform.
Data correspond to usage on the plateform after 2015. The current usage metrics is available 48-96 hours after online publication and is updated daily on week days.
Initial download of the metrics may take a while.