Open Access
Fig. F.7
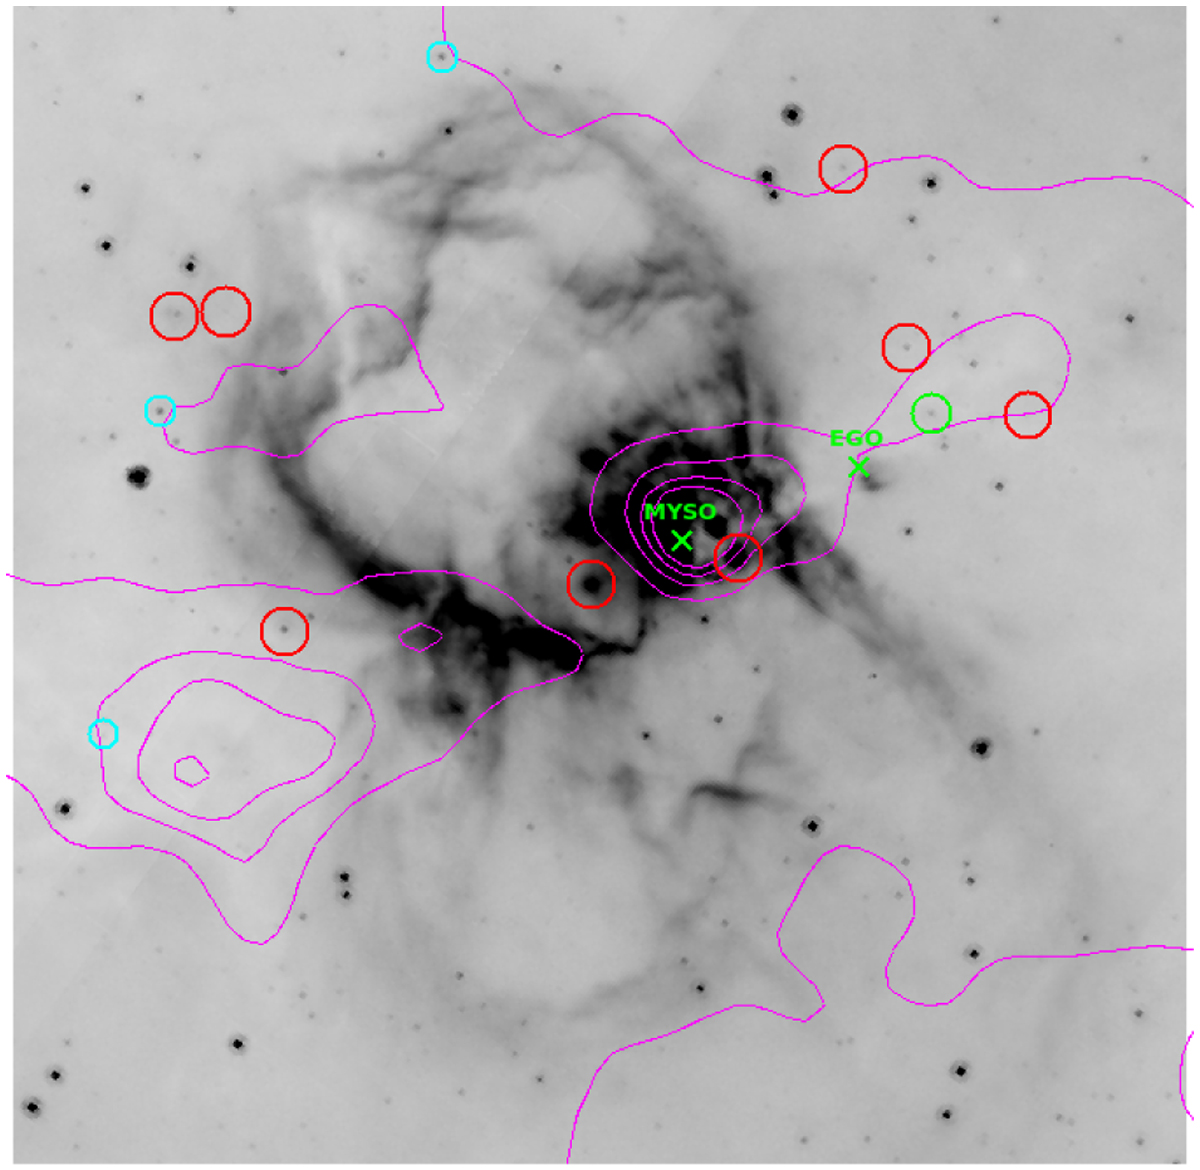
Spatial distributions of Class I (red circles), Flat (cyan circles), and Class II (green circle) on the 8.0 μm image. The contours correspond to column densities of 2, 4, 6, 8, and 10 × 1022 cm−2. The positions of the MYSO and EGO are also shown.
Current usage metrics show cumulative count of Article Views (full-text article views including HTML views, PDF and ePub downloads, according to the available data) and Abstracts Views on Vision4Press platform.
Data correspond to usage on the plateform after 2015. The current usage metrics is available 48-96 hours after online publication and is updated daily on week days.
Initial download of the metrics may take a while.