Open Access
Fig. E.10
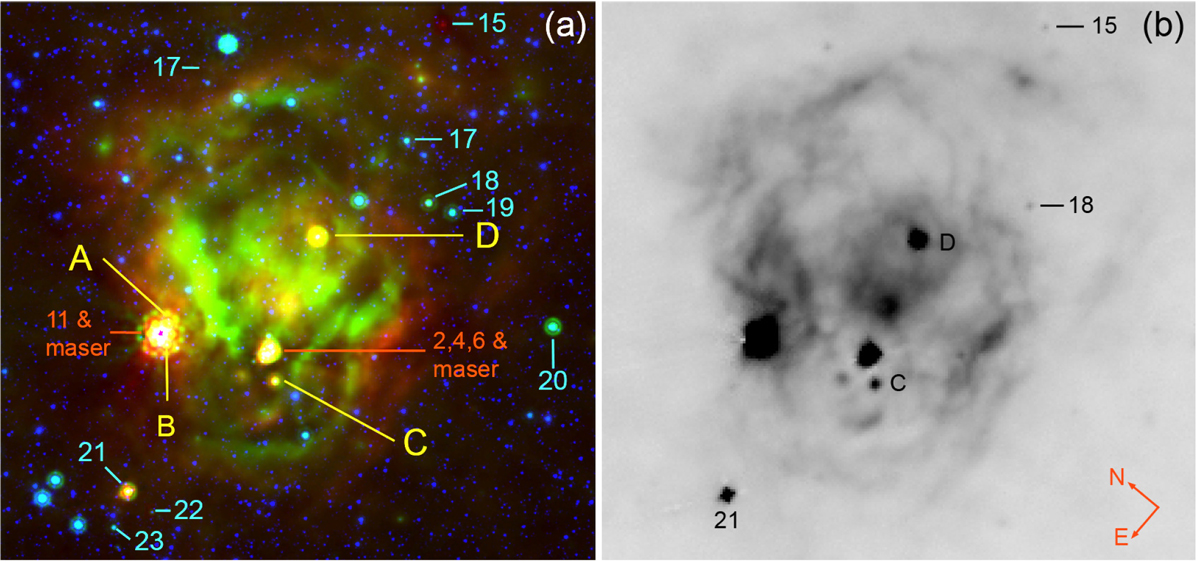
Sources in the G339.58–00.12 field (except in C1 and C2). Panel a: colour image with red, green, and blue indicating the 70 μm, 24 μm, and 4.5 μm images, respectively. Panel b: sources are identified on the Hi-GAL 70 μm image.
Current usage metrics show cumulative count of Article Views (full-text article views including HTML views, PDF and ePub downloads, according to the available data) and Abstracts Views on Vision4Press platform.
Data correspond to usage on the plateform after 2015. The current usage metrics is available 48-96 hours after online publication and is updated daily on week days.
Initial download of the metrics may take a while.