Fig. E.8
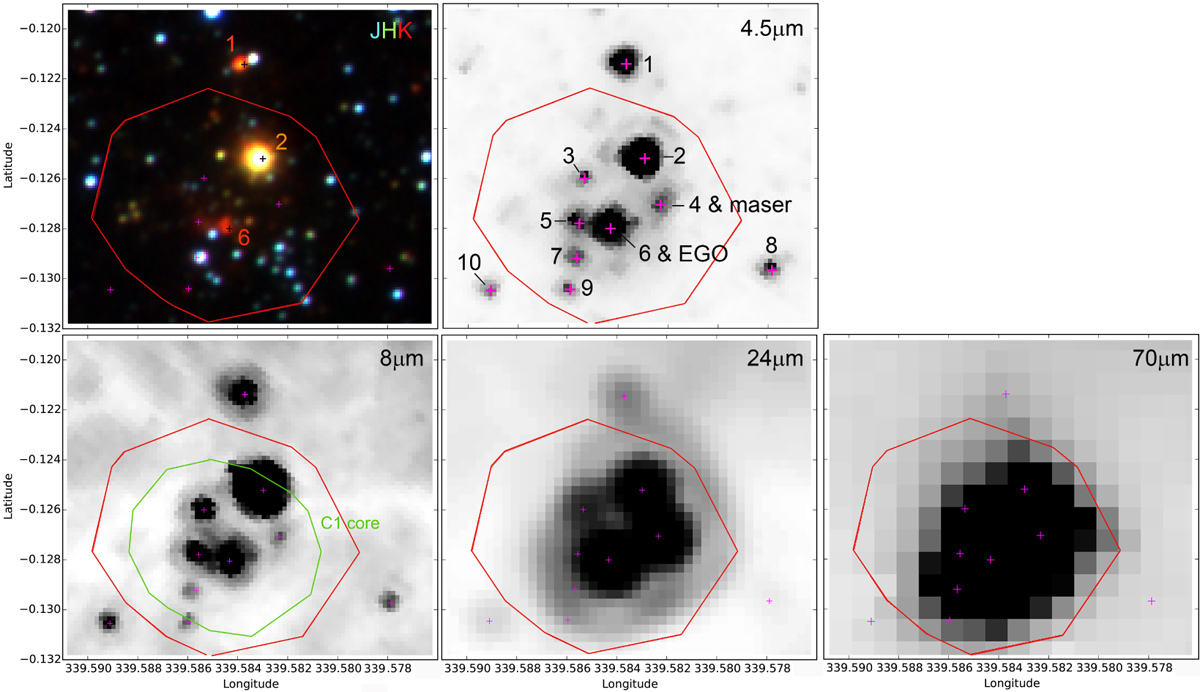
Sources in the direction of the C1 clump. The YSOs discussed in the text and in Table E.4 are identified on images in the NIR (JHKs colour composite image), at 4.5 μm, 8 μm, 24 μm, and 70 μm. The red contour corresponds to a column density of 1 × 1023 cm−2, and the green contour (superimposed on the 8 μm image) to a column density of 1.6 × 1023 cm−2. This latter contour follows a level that is half of the N(H2) peak’s intensity.
Current usage metrics show cumulative count of Article Views (full-text article views including HTML views, PDF and ePub downloads, according to the available data) and Abstracts Views on Vision4Press platform.
Data correspond to usage on the plateform after 2015. The current usage metrics is available 48-96 hours after online publication and is updated daily on week days.
Initial download of the metrics may take a while.