Open Access
Fig. E.4
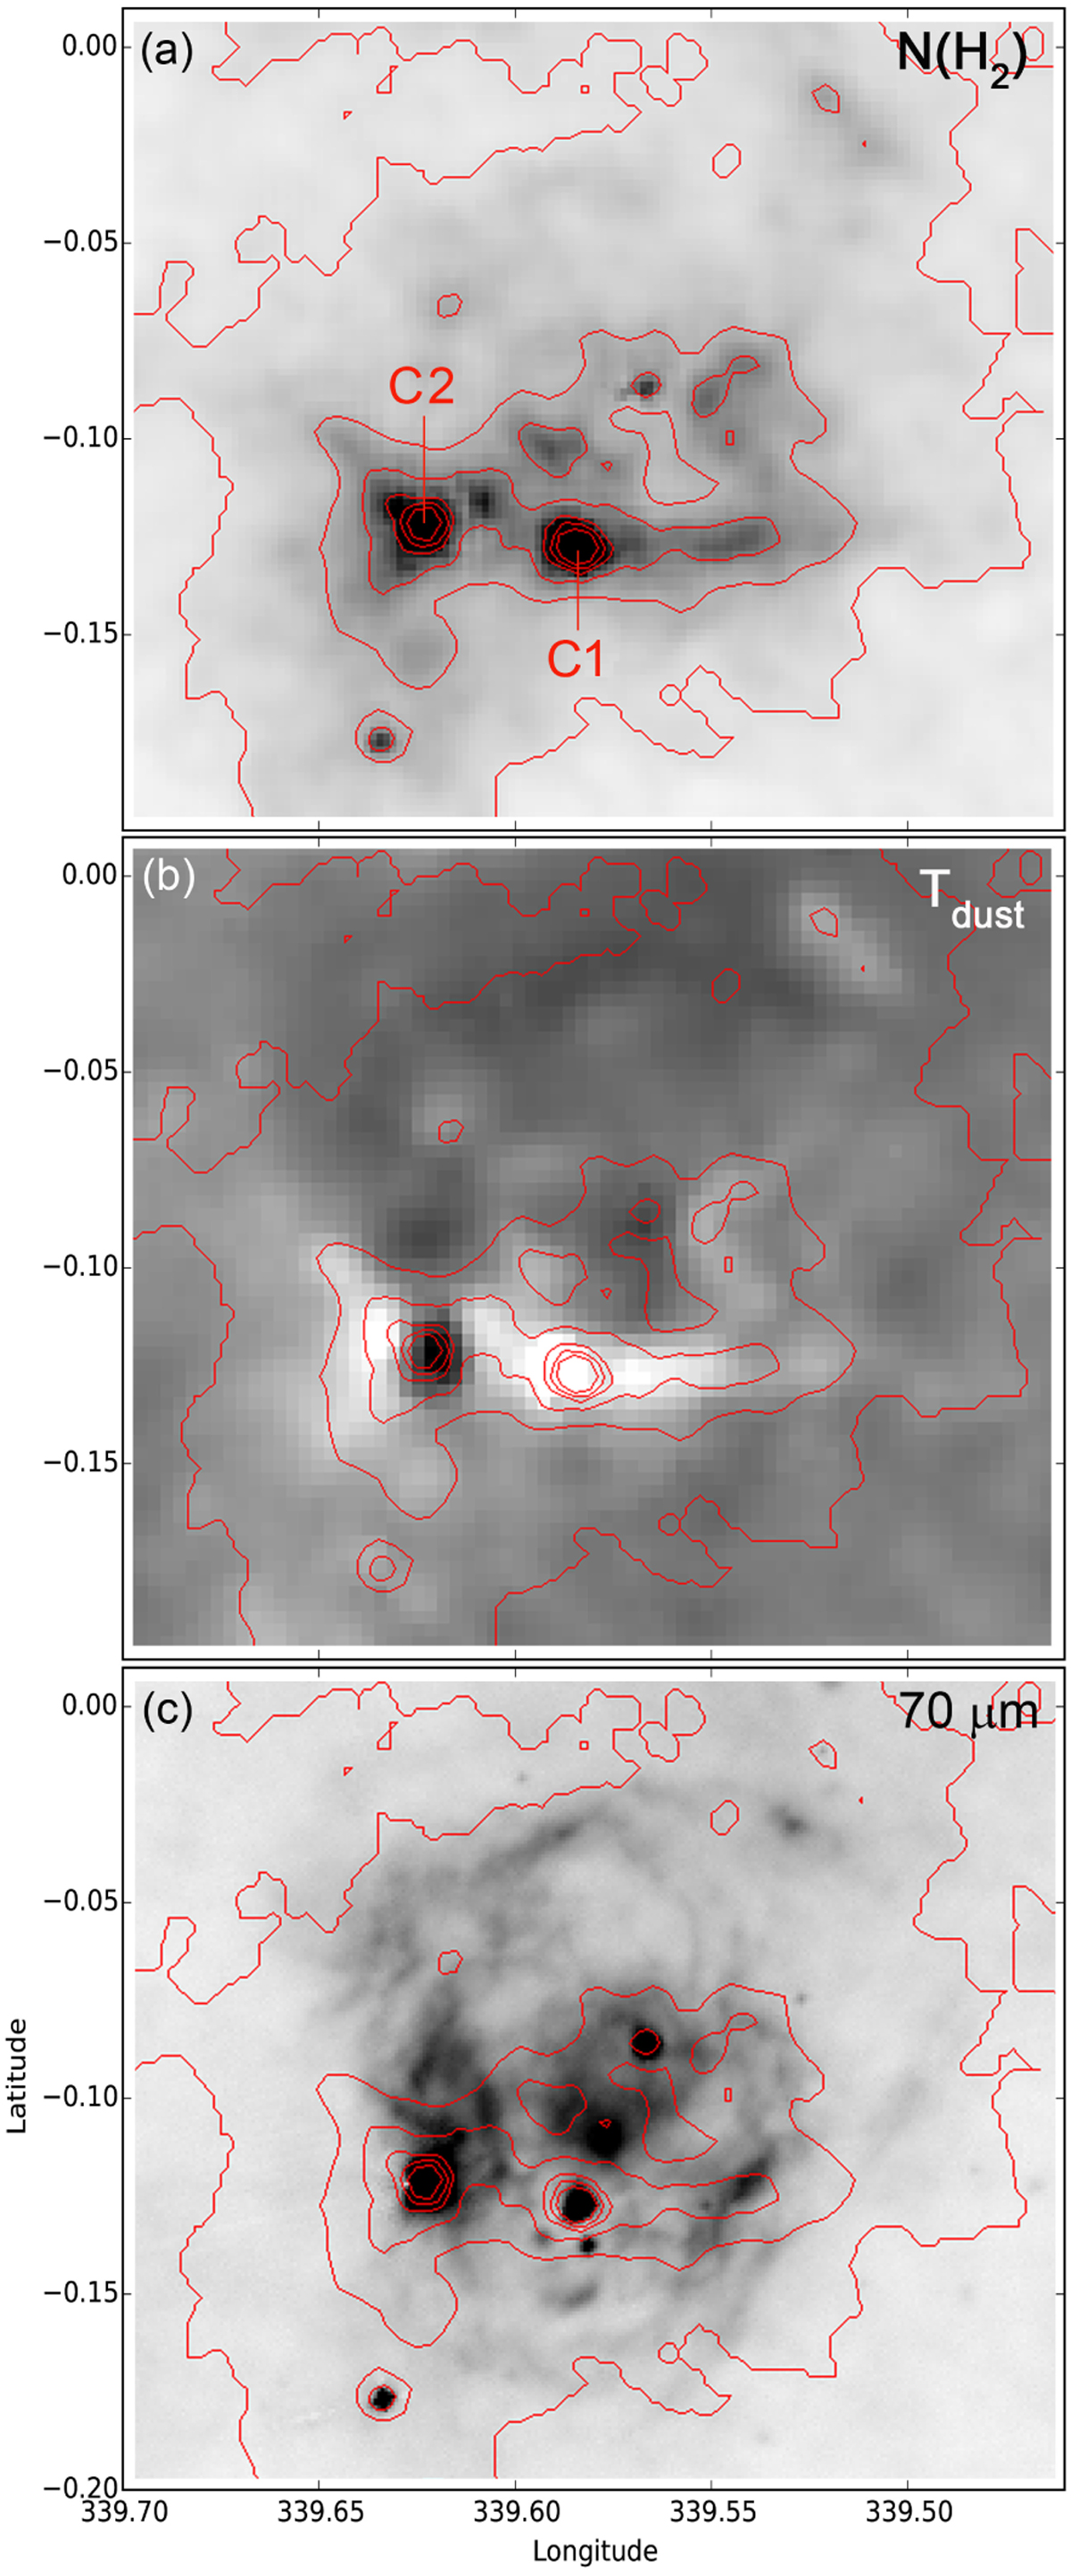
Column density in the vicinity of G339.58–00.12. Panel a: column density map; the red contours are for levels of 2, 3, 4, 6, 8, 10 × 1022 cm−2. Panel b: same contours superimposed on the dust temperature map. Panel c: same contours superimposed on the Herschel-70 μm image.
Current usage metrics show cumulative count of Article Views (full-text article views including HTML views, PDF and ePub downloads, according to the available data) and Abstracts Views on Vision4Press platform.
Data correspond to usage on the plateform after 2015. The current usage metrics is available 48-96 hours after online publication and is updated daily on week days.
Initial download of the metrics may take a while.