Fig. E.1
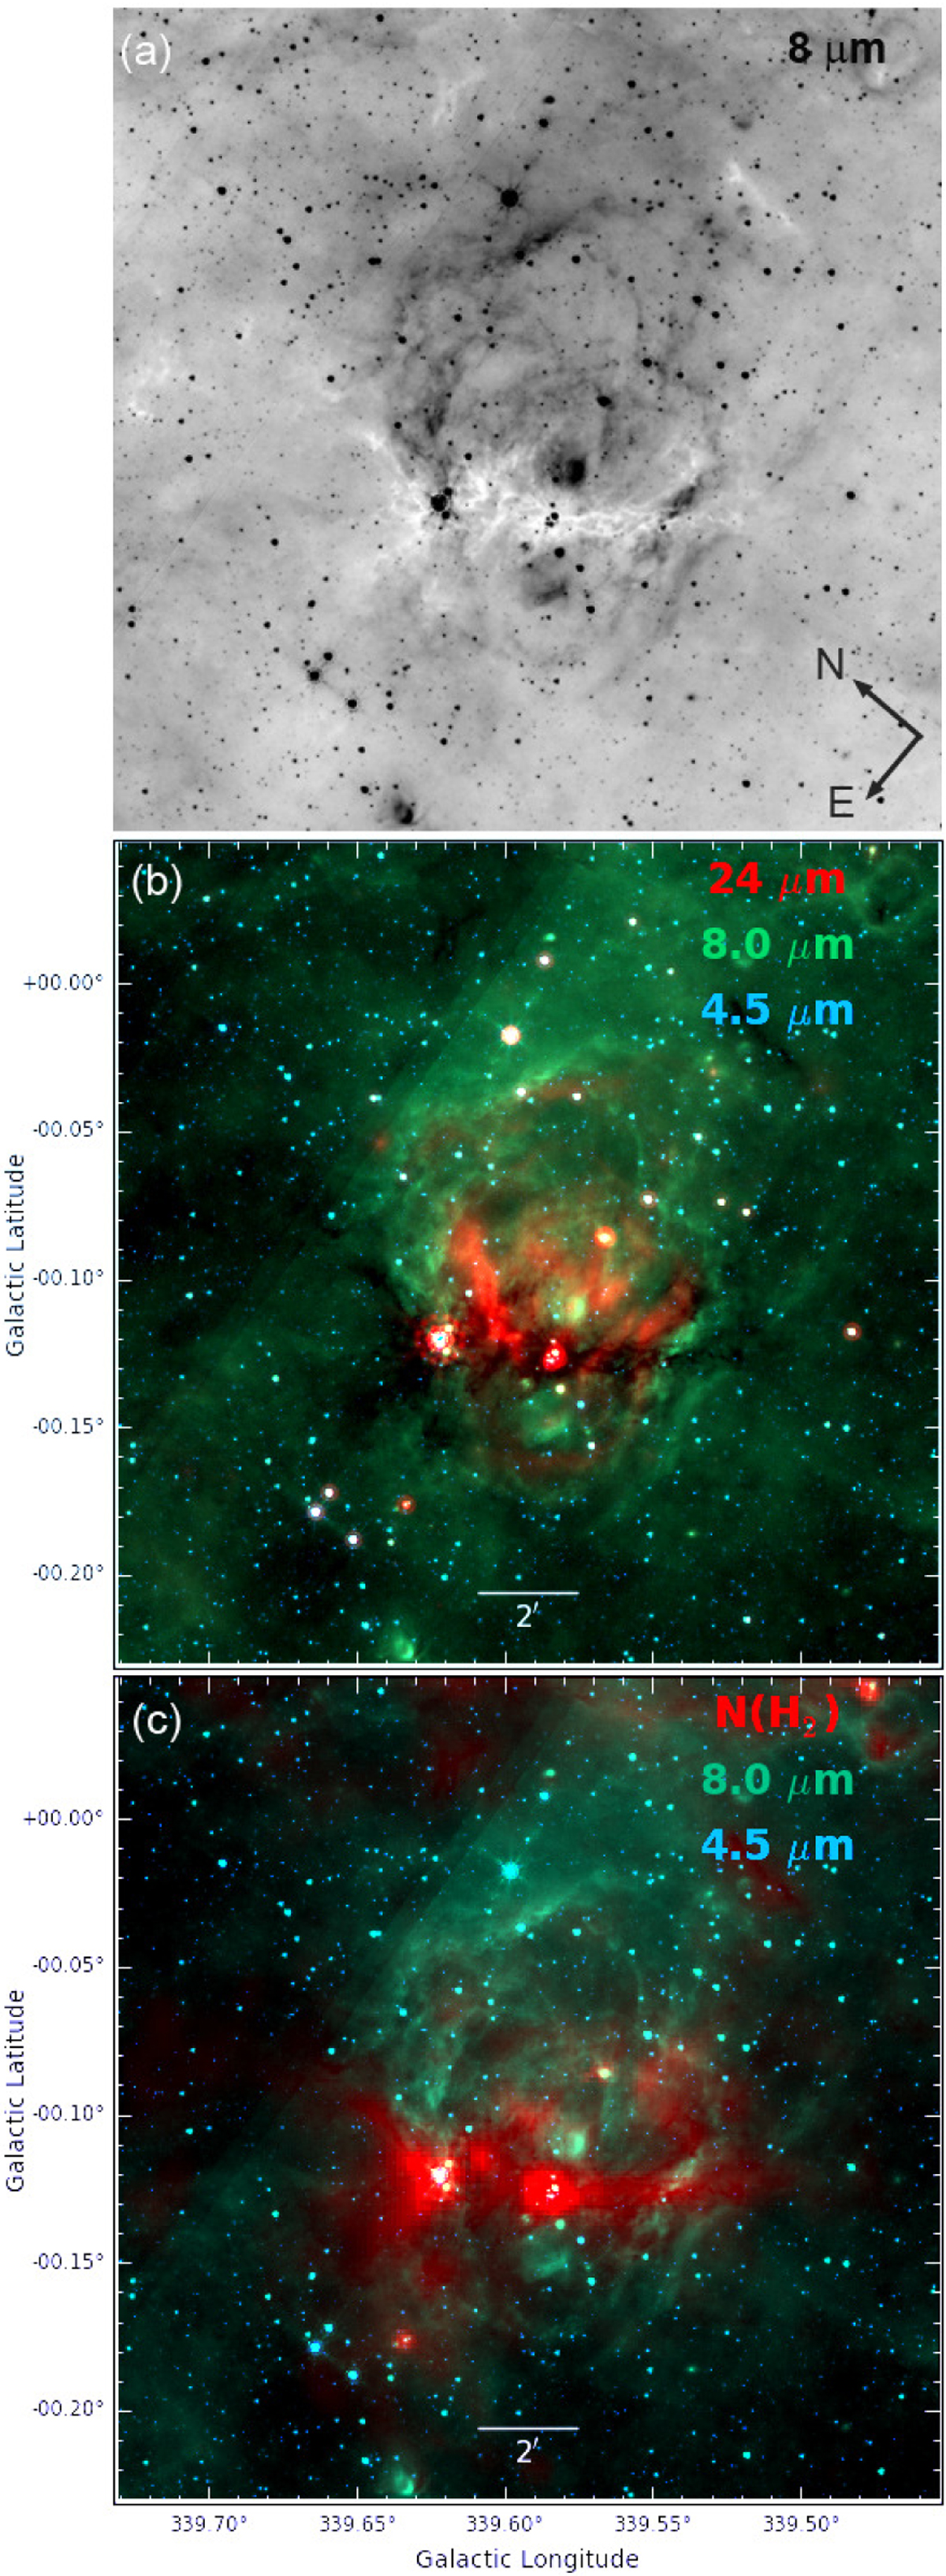
Bipolar nebula G339.58–00.12. Panel a: Spitzer 8.0 μm image showing the parental filament in absorption. Panel b: colour composite image with the Spitzer 4.5 μm, 8.0 μm, and 24 μm emissions shown in blue, green, and red, respectively. Panel c: red now shows the column density, showing the presence of two clumps along the parental filament.
Current usage metrics show cumulative count of Article Views (full-text article views including HTML views, PDF and ePub downloads, according to the available data) and Abstracts Views on Vision4Press platform.
Data correspond to usage on the plateform after 2015. The current usage metrics is available 48-96 hours after online publication and is updated daily on week days.
Initial download of the metrics may take a while.