Open Access
Fig. D.7
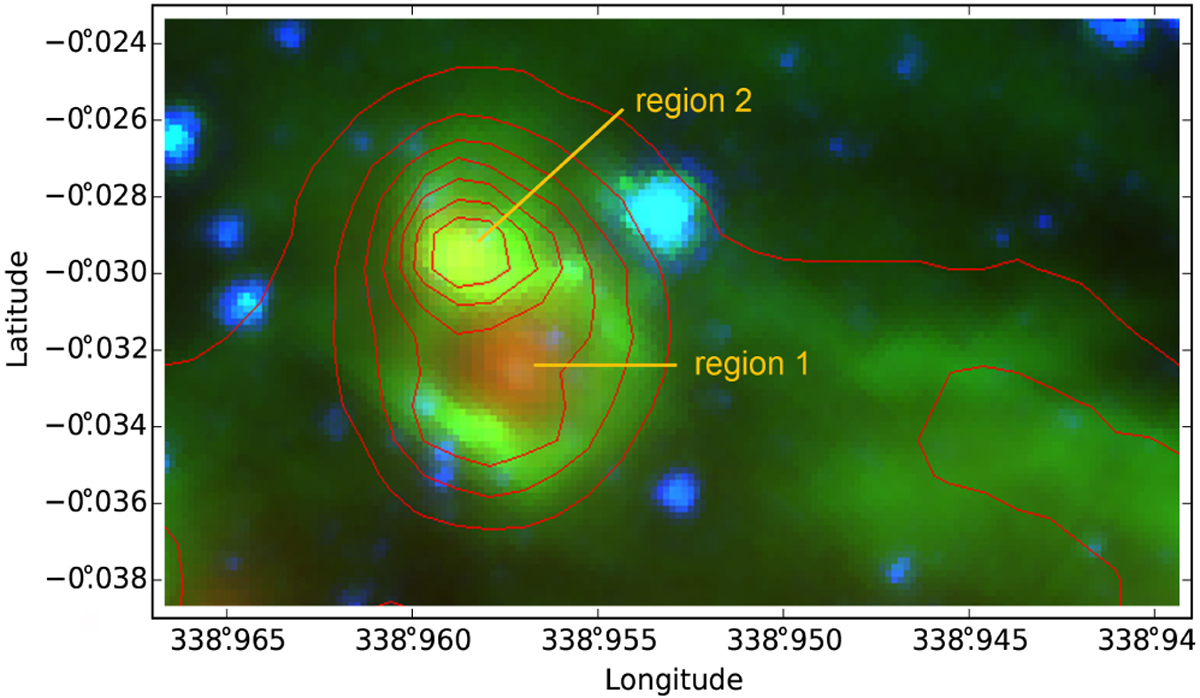
Two compact regions of extended 8.0 μm, 24 μm, and 70 μm emission lying on the border of G338.93–00.06. Red, green, and blue colours show the 24 μm, 8.0 μm, and 4.5 μm emissions, respectively. The red contours indicate the 70 μm emission (levels of 2000 MJy sr−1 to 8000 MJy sr−1 by s-eps-converted-to.pdf of 1000 MJy sr−1).
Current usage metrics show cumulative count of Article Views (full-text article views including HTML views, PDF and ePub downloads, according to the available data) and Abstracts Views on Vision4Press platform.
Data correspond to usage on the plateform after 2015. The current usage metrics is available 48-96 hours after online publication and is updated daily on week days.
Initial download of the metrics may take a while.