Fig. D.3
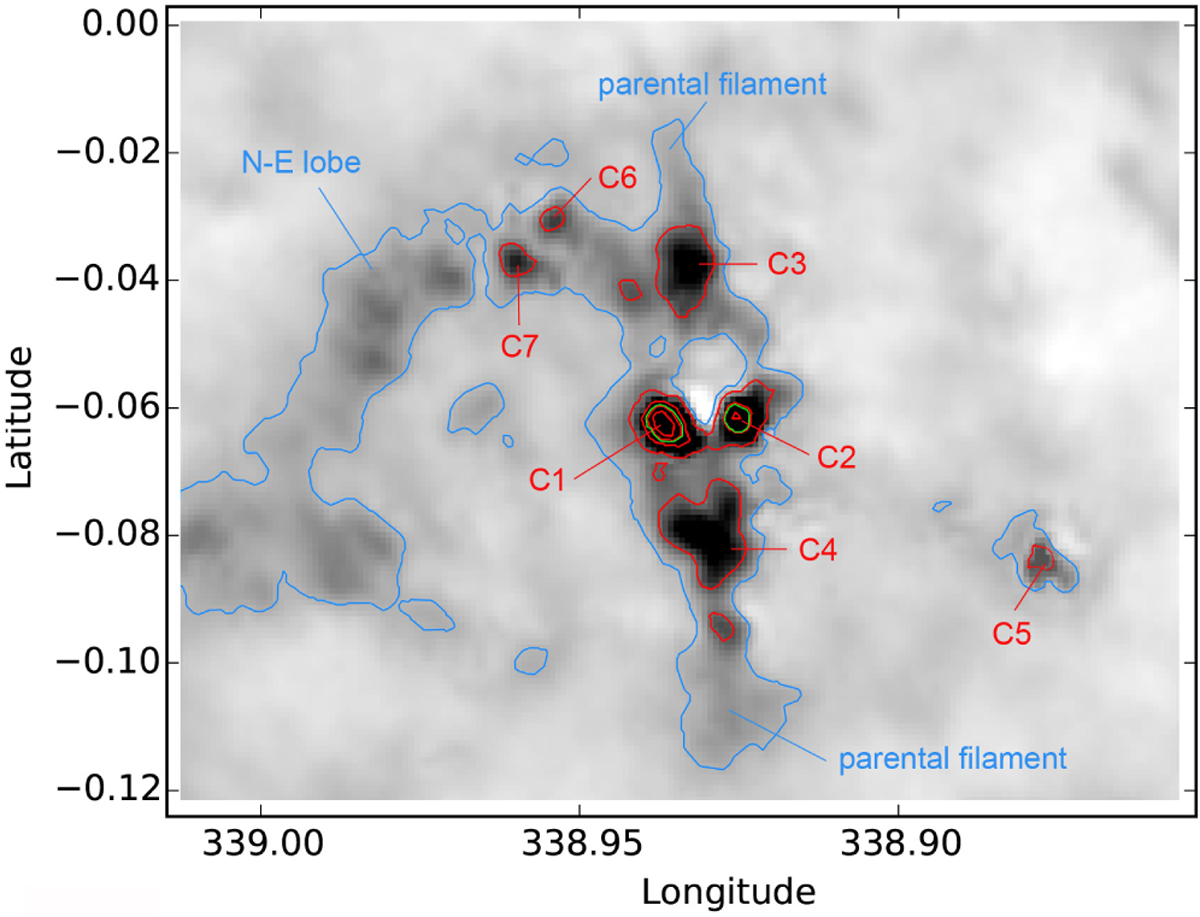
Column density map of the G338.93–00.06 field. The red contours are for the column density levels of 0.5, 1.0, 1.5, and 2 × 1023 cm−2, mainly showing the locations of the bright clumps. The blue contour corresponds to a column density level of 3.5 × 1022 cm−2. It mainly shows the collected material around the north-east lobe. The green contours are the aperture used to measure the mass and density for the central regions of the clumps.
Current usage metrics show cumulative count of Article Views (full-text article views including HTML views, PDF and ePub downloads, according to the available data) and Abstracts Views on Vision4Press platform.
Data correspond to usage on the plateform after 2015. The current usage metrics is available 48-96 hours after online publication and is updated daily on week days.
Initial download of the metrics may take a while.