Fig. C.10
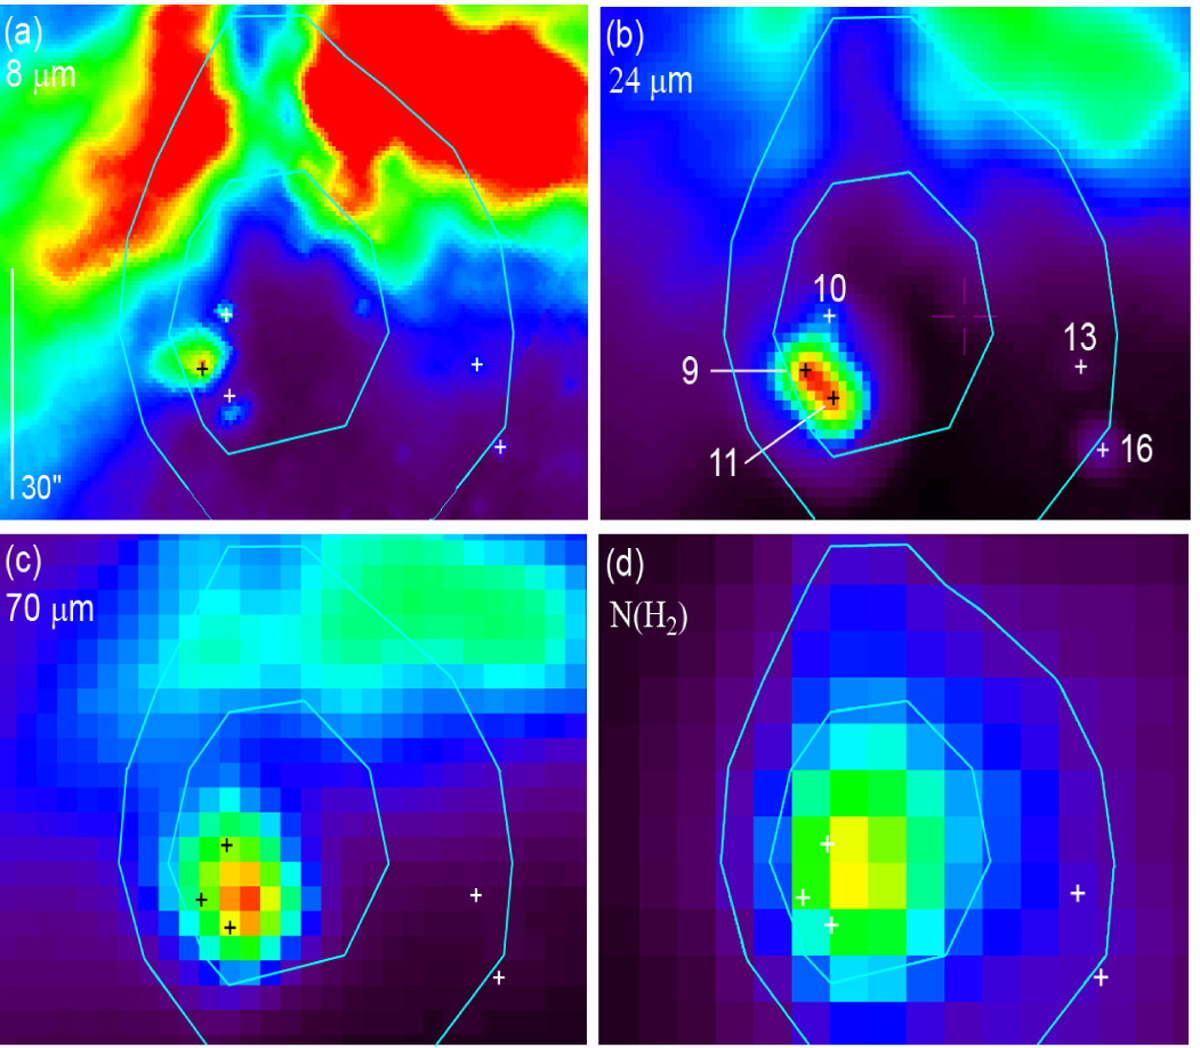
Spatial location of candidate YSOs in the direction of the C1 clump. The blue contours correspond to column densities of 0.5 × 1023 cm−2 and 1 × 1023 cm−2; they represent the emission in the central direction of the C1 clump and are superimposed on the 8.0 μm (panel a), 24 μm (panel b), 70 μm (panel c), and column density (panel d) maps. The YSOs are identified by plus symbolss.
Current usage metrics show cumulative count of Article Views (full-text article views including HTML views, PDF and ePub downloads, according to the available data) and Abstracts Views on Vision4Press platform.
Data correspond to usage on the plateform after 2015. The current usage metrics is available 48-96 hours after online publication and is updated daily on week days.
Initial download of the metrics may take a while.