Fig. 4
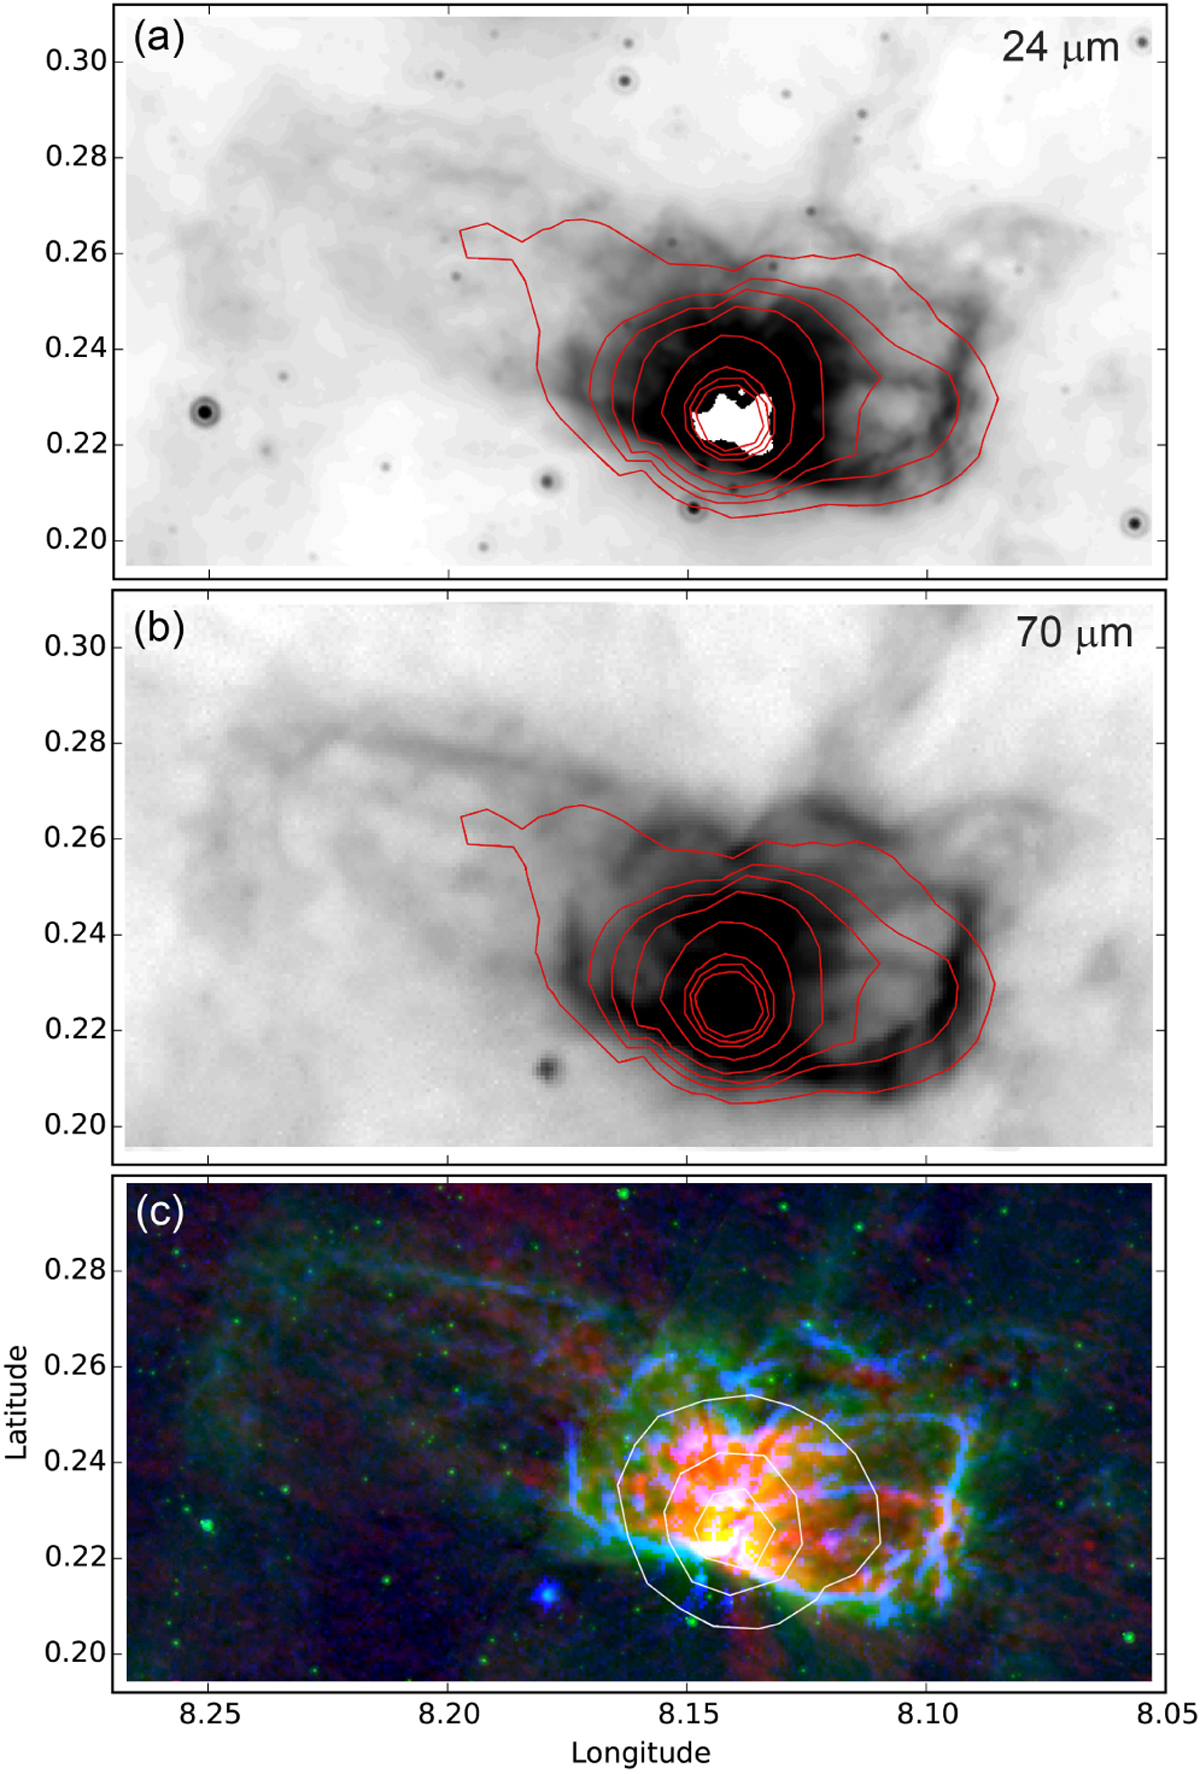
Radio-continuum emission of G008.14+00.23. The Spitzer 24 μm (saturated in the centre) image (panel a) and the Herschel 70 μm image (panel b) over-plotted with 1.4 GHz contours from the NVSS survey (contour levels of 0.01, 0.05, 0.1, 0.5, 1.0, 1.5, 1.25, and 1.5 Jy beam−1). Panel c: colour composite image; red highlights the radio emission at 20 cm from MAGPIS survey (in logarithmic units), green shows the 8 μm emission, and blue shows the unsharp 70 μm emission (tohighlight the borders of the ionised lobes). The white contours indicate the NVSS radio emission (contour levels of 0.1, 0.5, and 1.0 Jy beam−1).
Current usage metrics show cumulative count of Article Views (full-text article views including HTML views, PDF and ePub downloads, according to the available data) and Abstracts Views on Vision4Press platform.
Data correspond to usage on the plateform after 2015. The current usage metrics is available 48-96 hours after online publication and is updated daily on week days.
Initial download of the metrics may take a while.