Fig. C.7
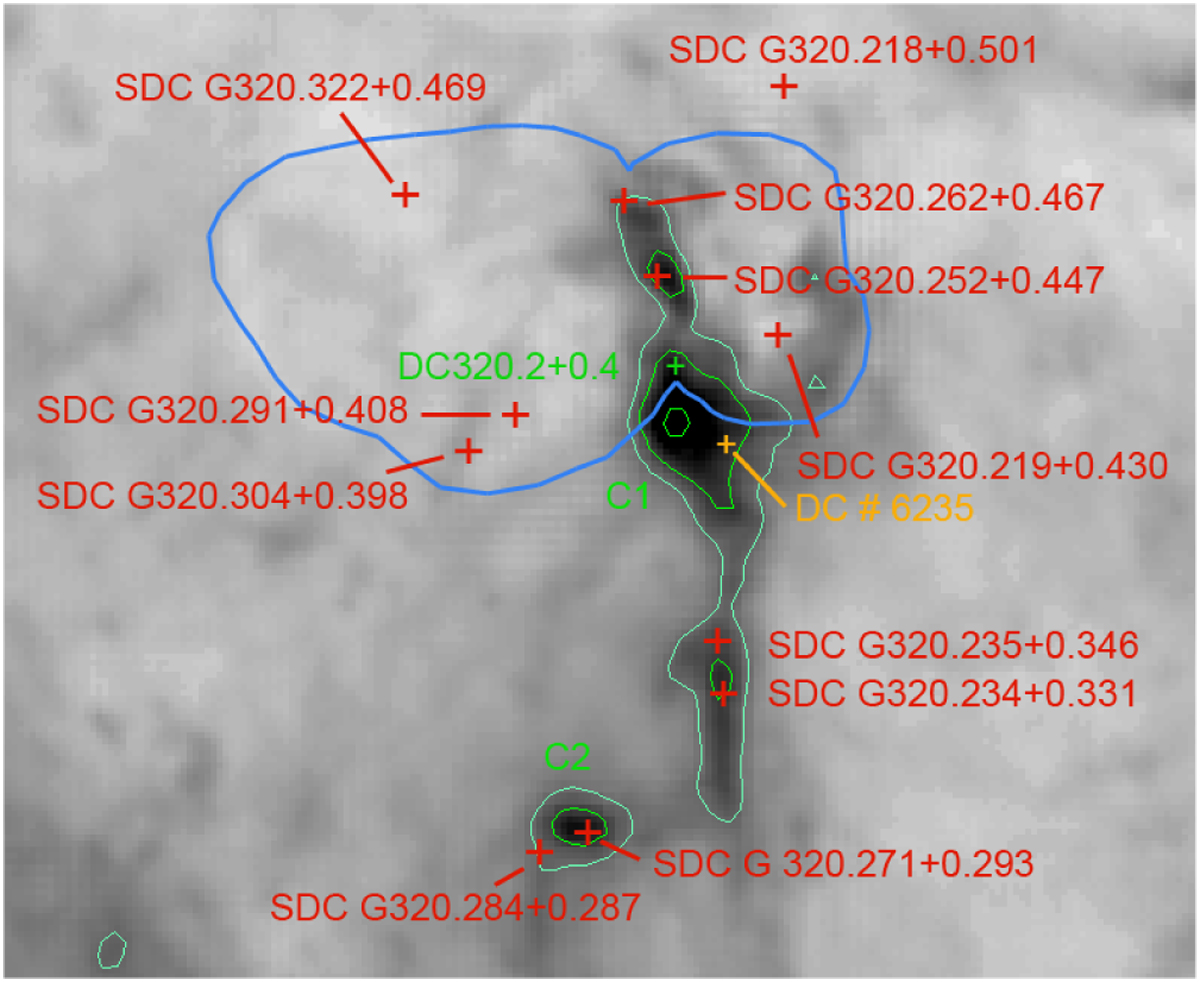
IRDCs in the field of G320.25+00.44. The IRDCs identified by Peretto & Fuller (2009) are in red, the ones identified by Hartley et al. (1986) and Dobashi (2011) are respectively in green and yellow. The underlying grey image is the column density map; the green contours correspond to column densities of 1.5 × 10²², 2.5 × 10²², and 10 × 1022 cm−2. The blue contour indicates the extent of the bipolar nebula.
Current usage metrics show cumulative count of Article Views (full-text article views including HTML views, PDF and ePub downloads, according to the available data) and Abstracts Views on Vision4Press platform.
Data correspond to usage on the plateform after 2015. The current usage metrics is available 48-96 hours after online publication and is updated daily on week days.
Initial download of the metrics may take a while.