Fig. C.3
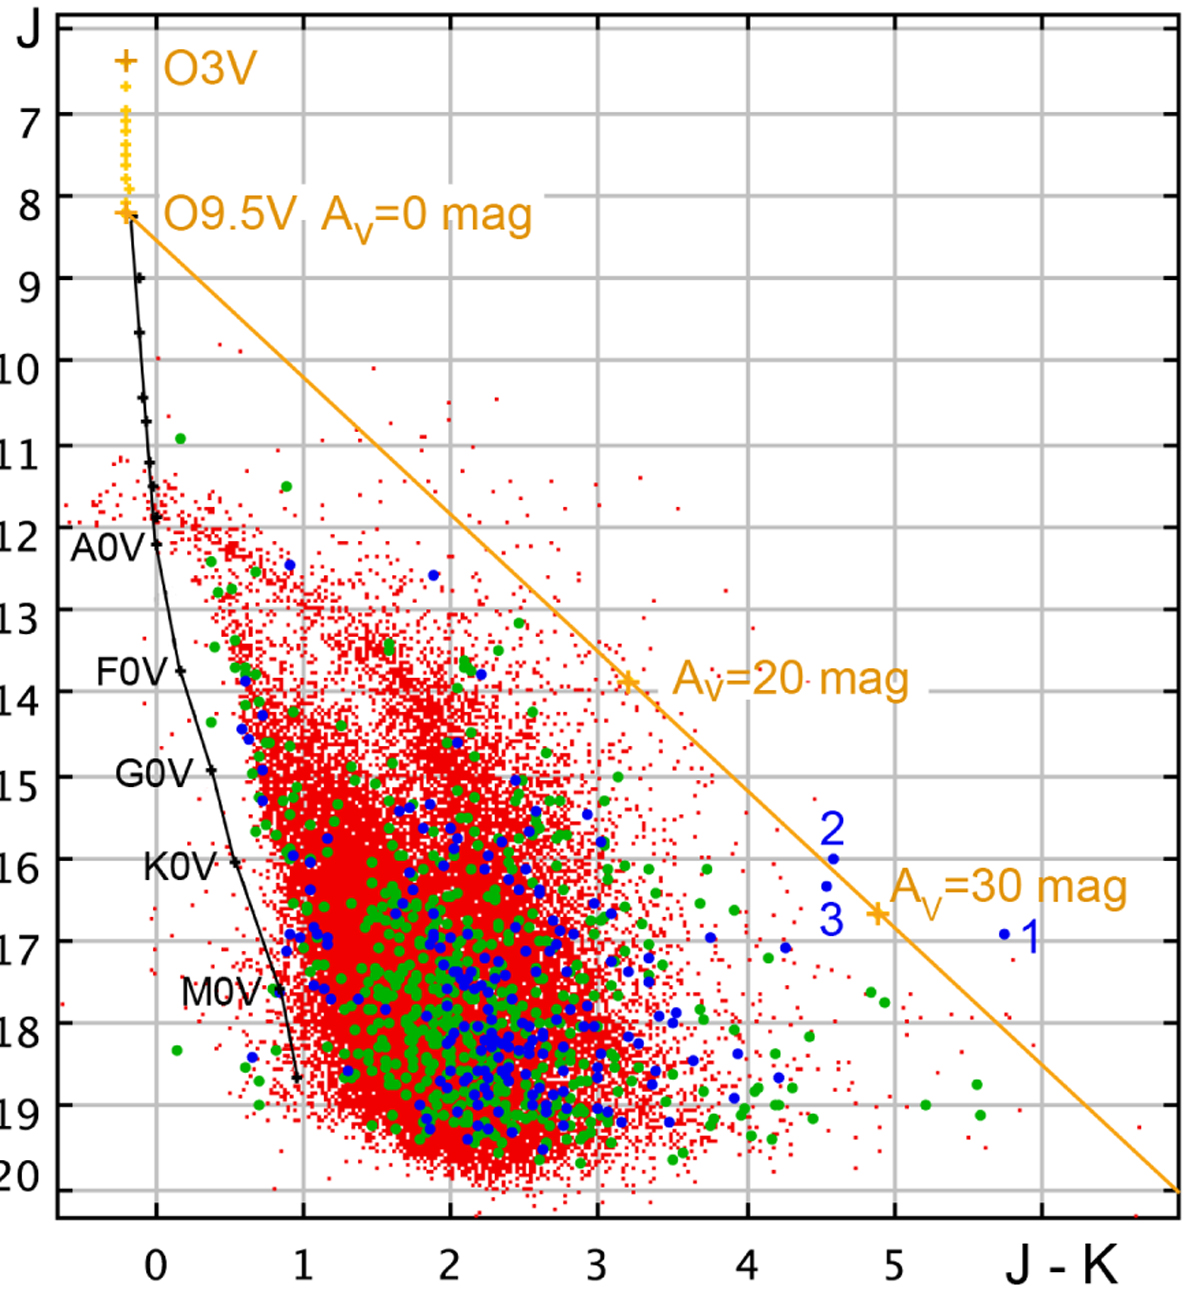
J vs. J − K diagram for the stars located at less than 10′ from the centre of the radio-continuum emission (red symbols). The main sequence for O stars (Martins & Plez 2006) and low-mass stars (Pecaut & Mamajek 2013) are drawn in orange and black curved lines, respectively, for a distance of 2.1 kpc and zeroreddening. The reddening vector corresponding to an O9.5 star is drawn as a slanting line using the extinction law of Rieke & Lebofsky (1985). The green and blue symbols represent stars located at less than 1 pc and 0.5 pc from the 24 μm centre, respectively. Possible exciting stars are numbered as #1, #2, and #3 in the figure. They are identified in Fig. C.4.
Current usage metrics show cumulative count of Article Views (full-text article views including HTML views, PDF and ePub downloads, according to the available data) and Abstracts Views on Vision4Press platform.
Data correspond to usage on the plateform after 2015. The current usage metrics is available 48-96 hours after online publication and is updated daily on week days.
Initial download of the metrics may take a while.