Fig. C.2
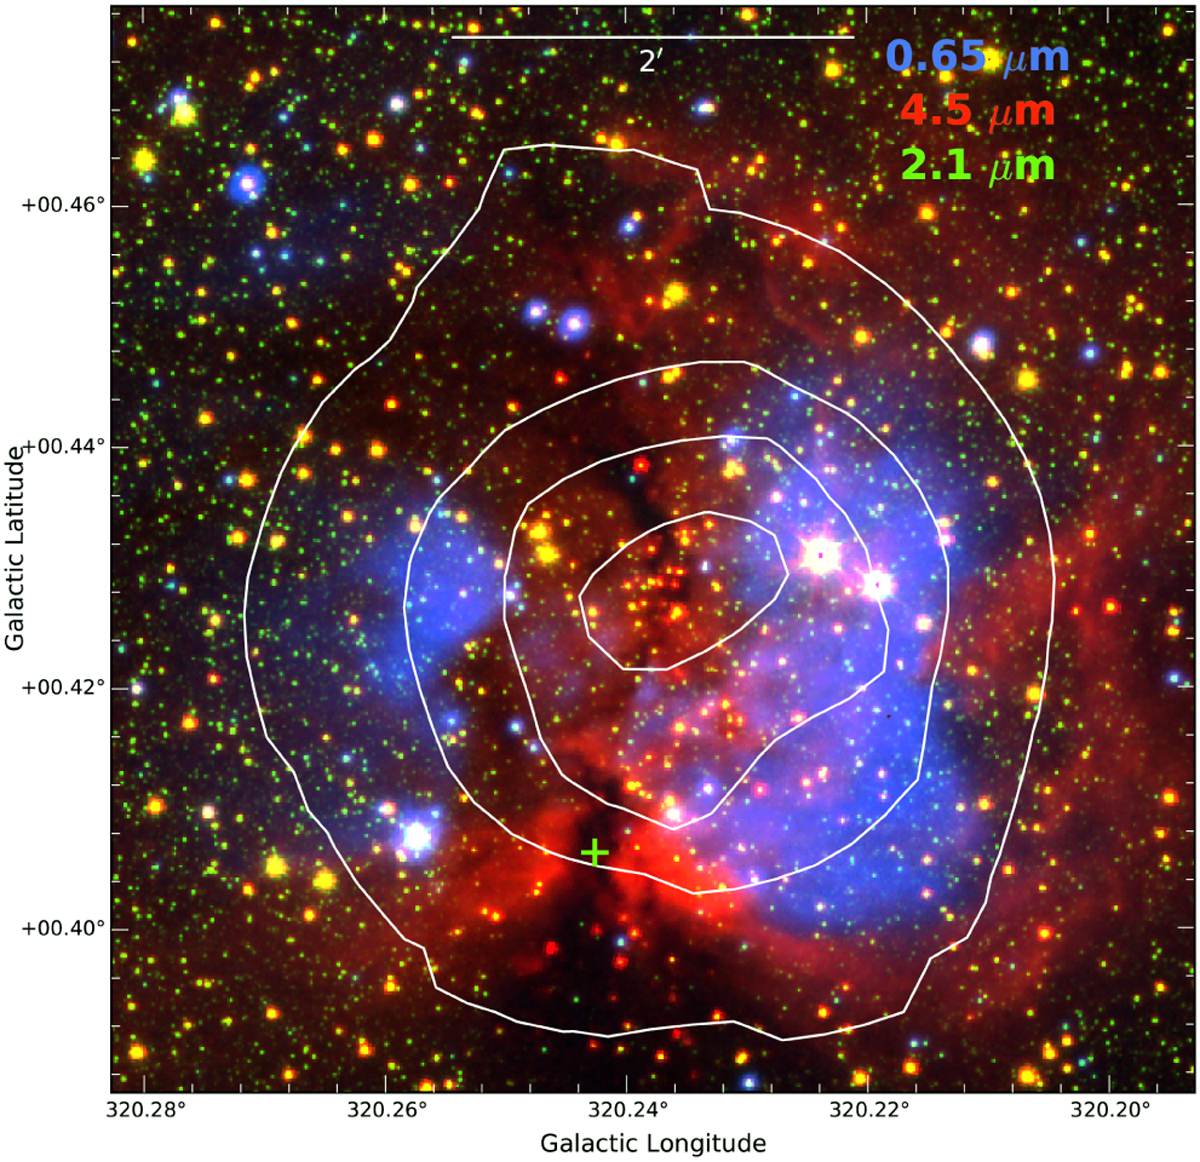
Central region of G320.25 + 00.44 at optical and NIR bands. Red indicates the 4.5 μm emission (shows the presence of a small cluster at the very centre of the nebula) and green shows the Ks VISTA image. The Hα SuperCOSMOS image is shown in blue. The white contours correspond to the radio emission at 843 MHz for the central region (contour levels of 0.015, 0.09, 0.16, and 0.23 Jy beam−1). The green cross corresponds to the position of IRAS 15033–5736.
Current usage metrics show cumulative count of Article Views (full-text article views including HTML views, PDF and ePub downloads, according to the available data) and Abstracts Views on Vision4Press platform.
Data correspond to usage on the plateform after 2015. The current usage metrics is available 48-96 hours after online publication and is updated daily on week days.
Initial download of the metrics may take a while.