Fig. 3
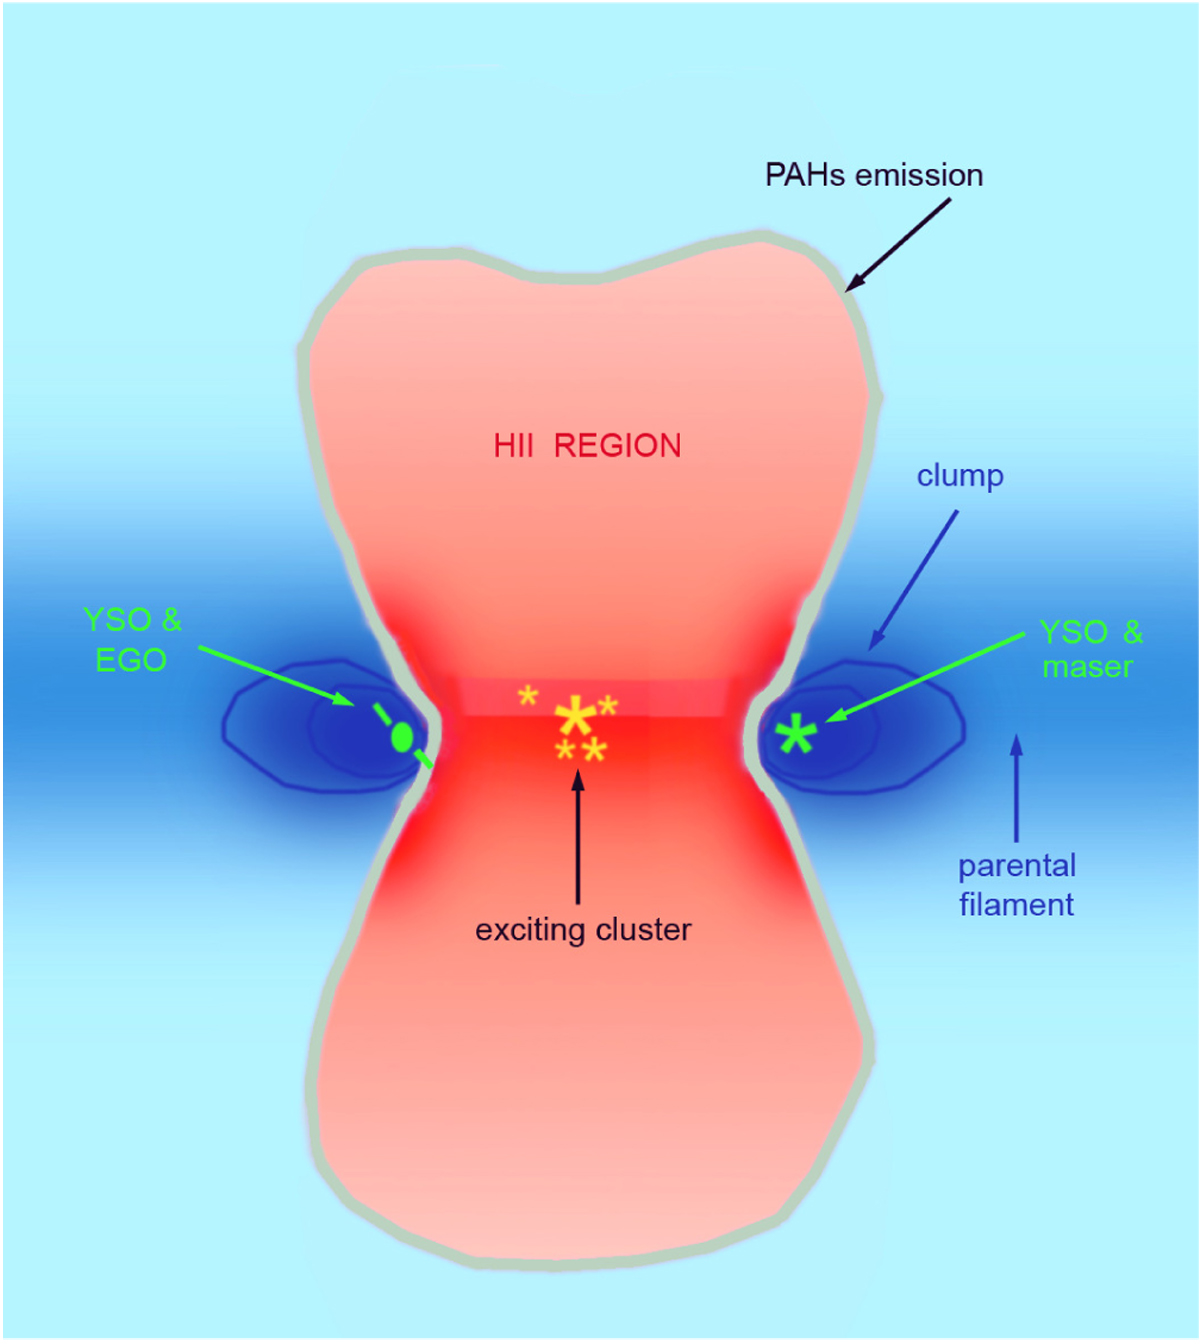
Overall morphology of a bipolar H II region and its environment. Pink highlights for the ionised gas, blue the molecular material, and grey shows PAH emission at 8.0 μm. Various sources are also represented. The two lobes are, in general, well traced at 8.0 μm; a wavelength band is dominated by the emission of PAHs located in the PDR surrounding the ionised gas. There is a dense filament, observed as a cold elongated high-column-density feature at the centre of the lobes. This structure appears in emission at Herschel-SPIRE wavelengths and in absorption at 8 and 24 μm.
Current usage metrics show cumulative count of Article Views (full-text article views including HTML views, PDF and ePub downloads, according to the available data) and Abstracts Views on Vision4Press platform.
Data correspond to usage on the plateform after 2015. The current usage metrics is available 48-96 hours after online publication and is updated daily on week days.
Initial download of the metrics may take a while.