Open Access
Fig. B.11
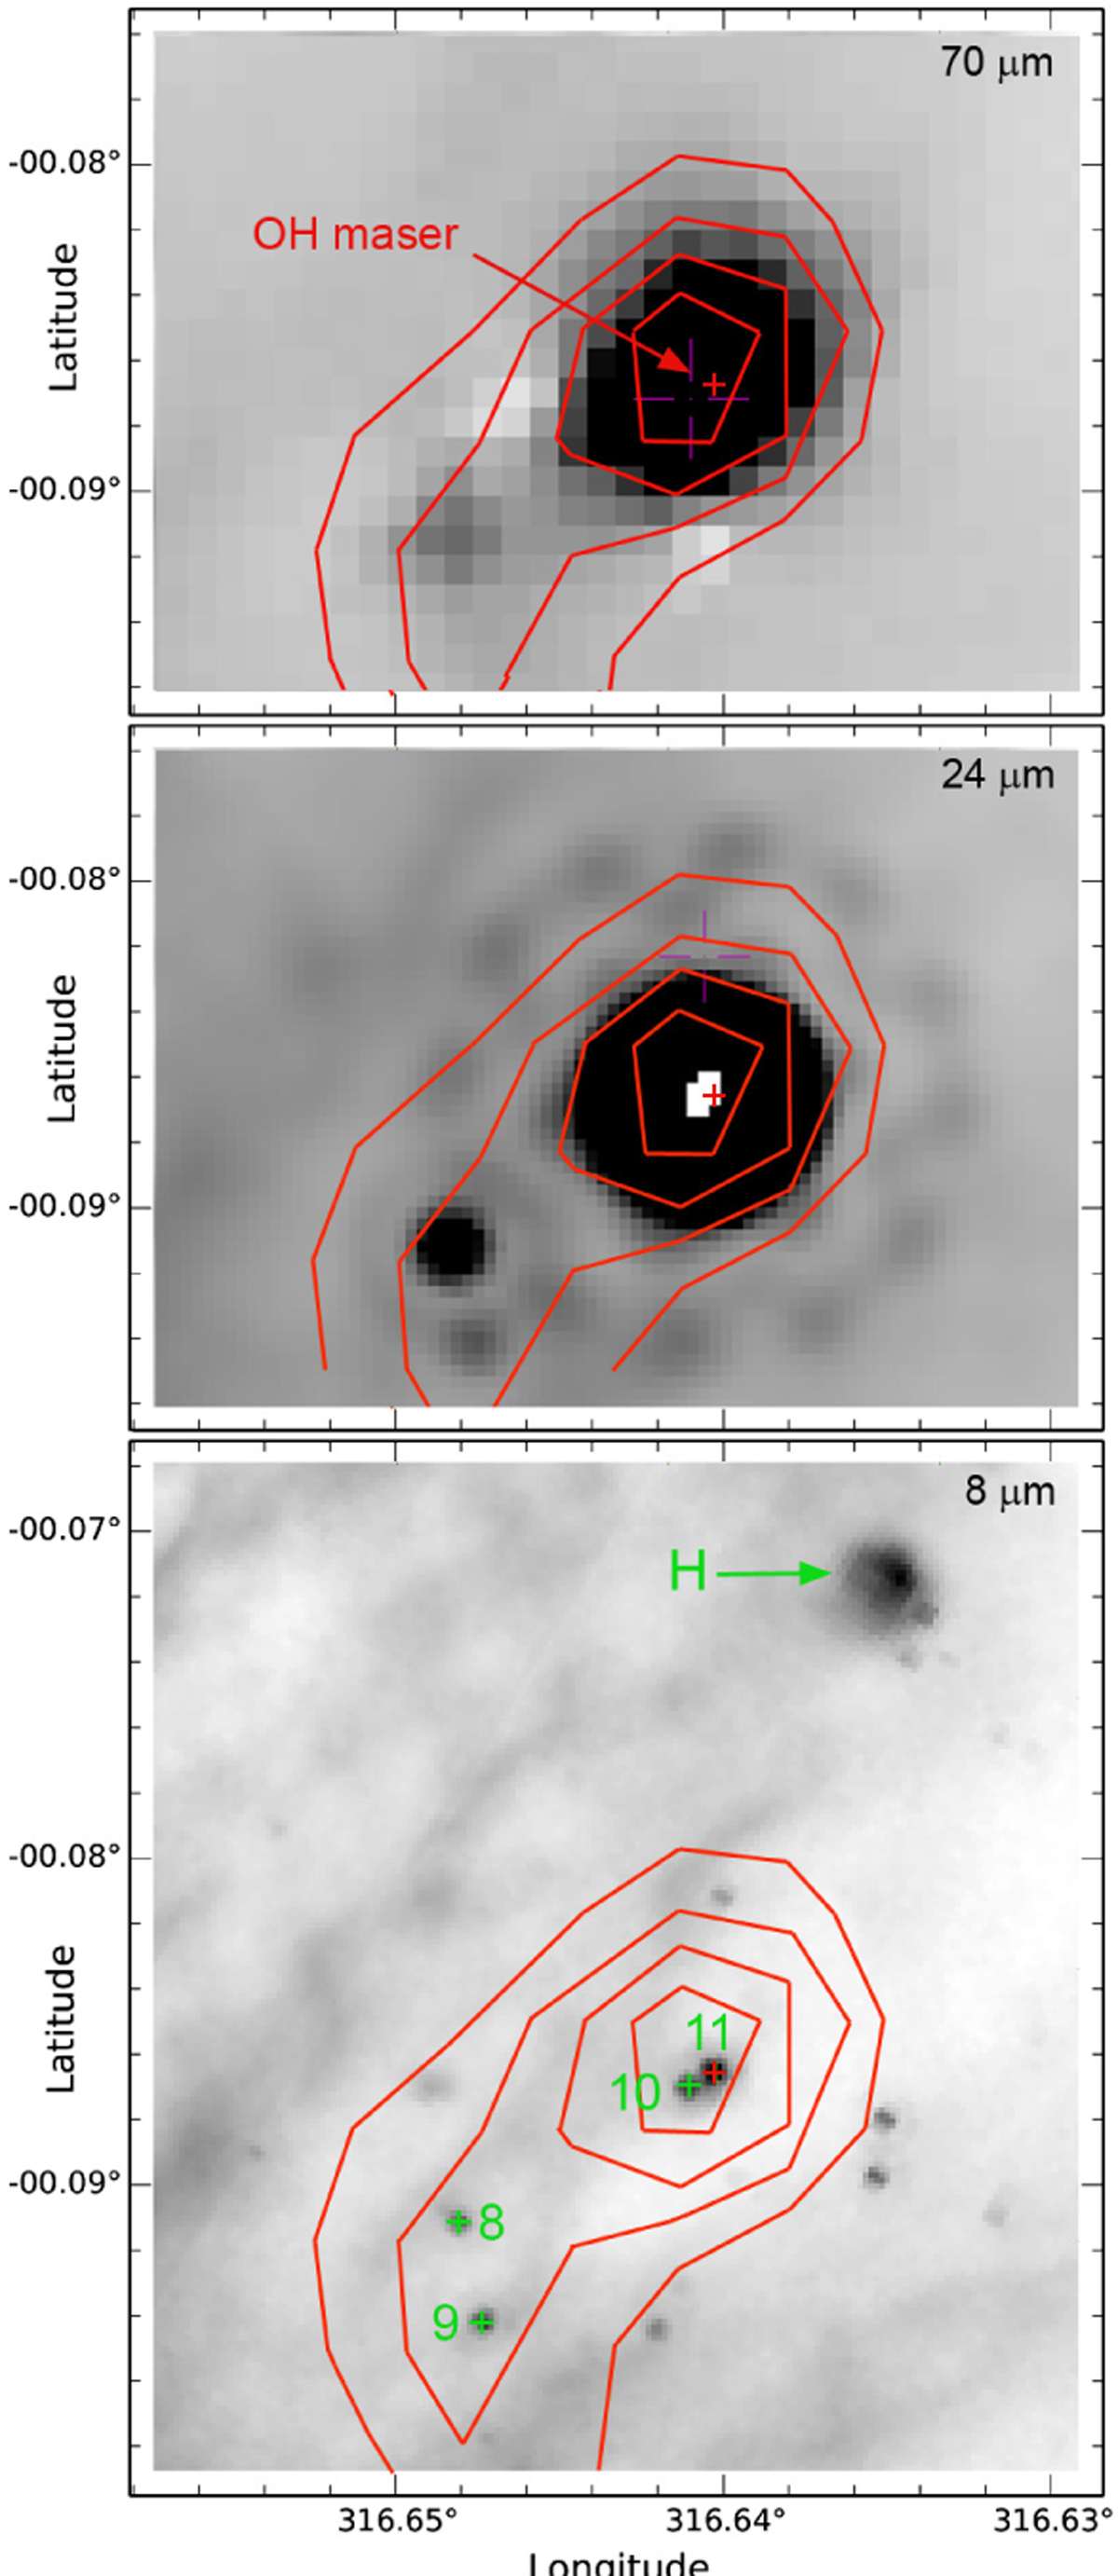
Third site of maser emission at 8 μm, 24 μm, and 70 μm. The OH maser position is indicated with a red arrow. The red contours are for the column density (levels of 4, 5, 6, and 7 × 1022 cm−2). The diffuse extended region, H, is identified in the 8 μm image.
Current usage metrics show cumulative count of Article Views (full-text article views including HTML views, PDF and ePub downloads, according to the available data) and Abstracts Views on Vision4Press platform.
Data correspond to usage on the plateform after 2015. The current usage metrics is available 48-96 hours after online publication and is updated daily on week days.
Initial download of the metrics may take a while.