Fig. B.9
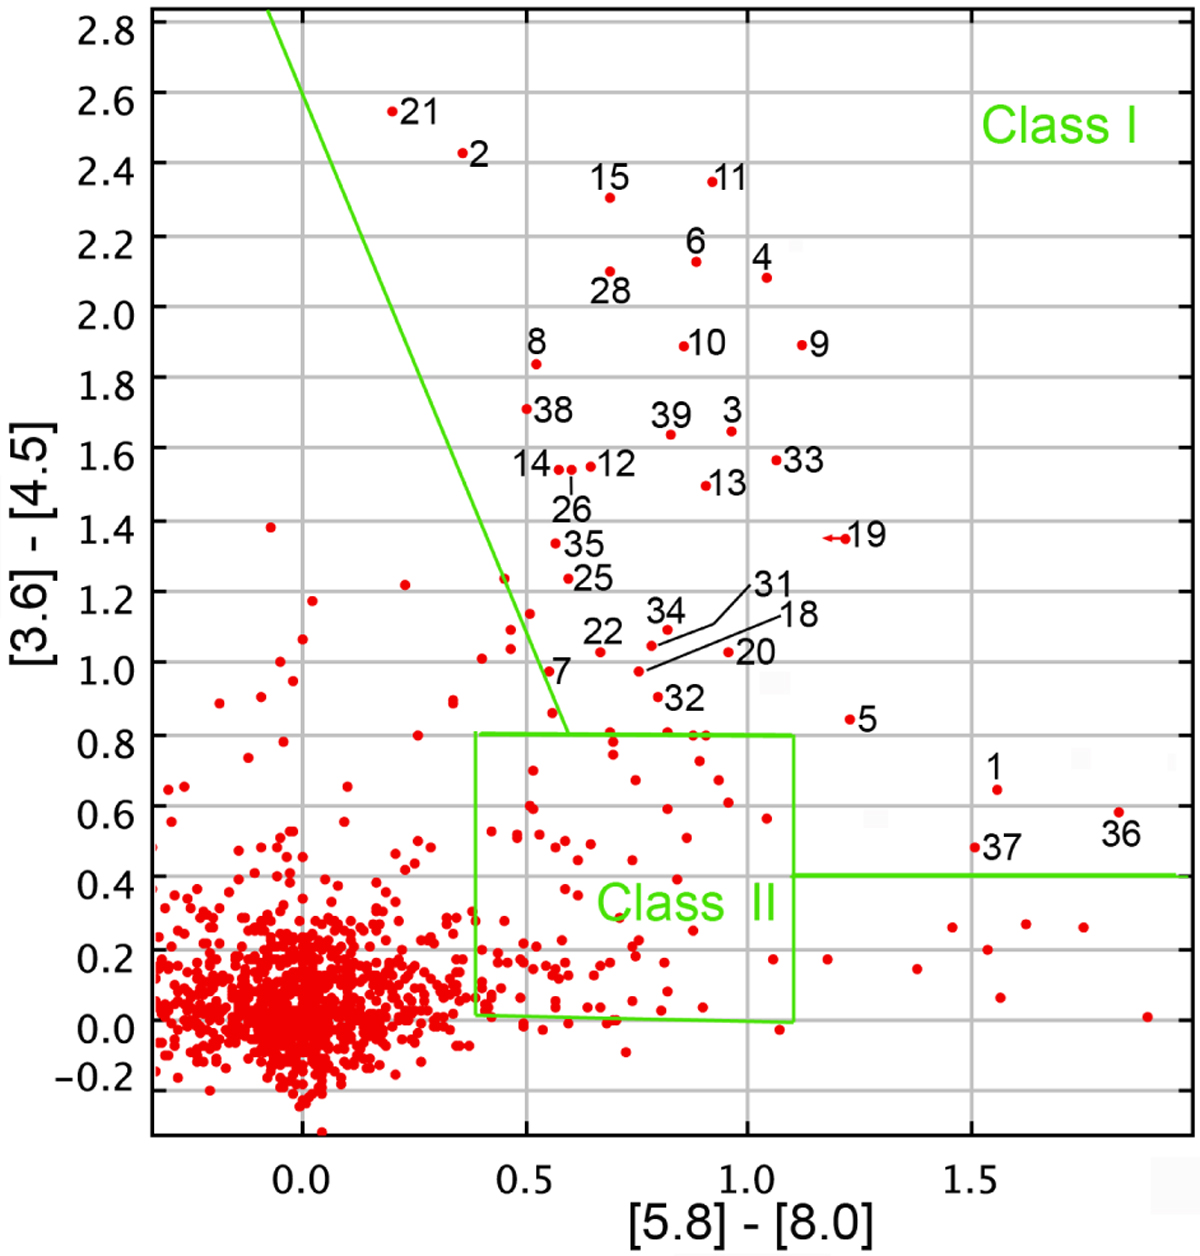
Colour–colour diagram, [3.6]–[4.5] vs. [5.8]–[8.0], for all Spitzer-GLIMPSE sources with measurements in the four bands, and situated within 10′ from the radio peak of the G316.80–00.05 field. The location of YSOs dominated by a disk (Class II YSOs) and by an envelope(Class I YSOs) are indicated, following Allen et al. (2004; see also Megeath et al. 2004). The sources discussed in the text, mainly candidate Class I YSOs, are identified.
Current usage metrics show cumulative count of Article Views (full-text article views including HTML views, PDF and ePub downloads, according to the available data) and Abstracts Views on Vision4Press platform.
Data correspond to usage on the plateform after 2015. The current usage metrics is available 48-96 hours after online publication and is updated daily on week days.
Initial download of the metrics may take a while.