Open Access
Fig. B.8
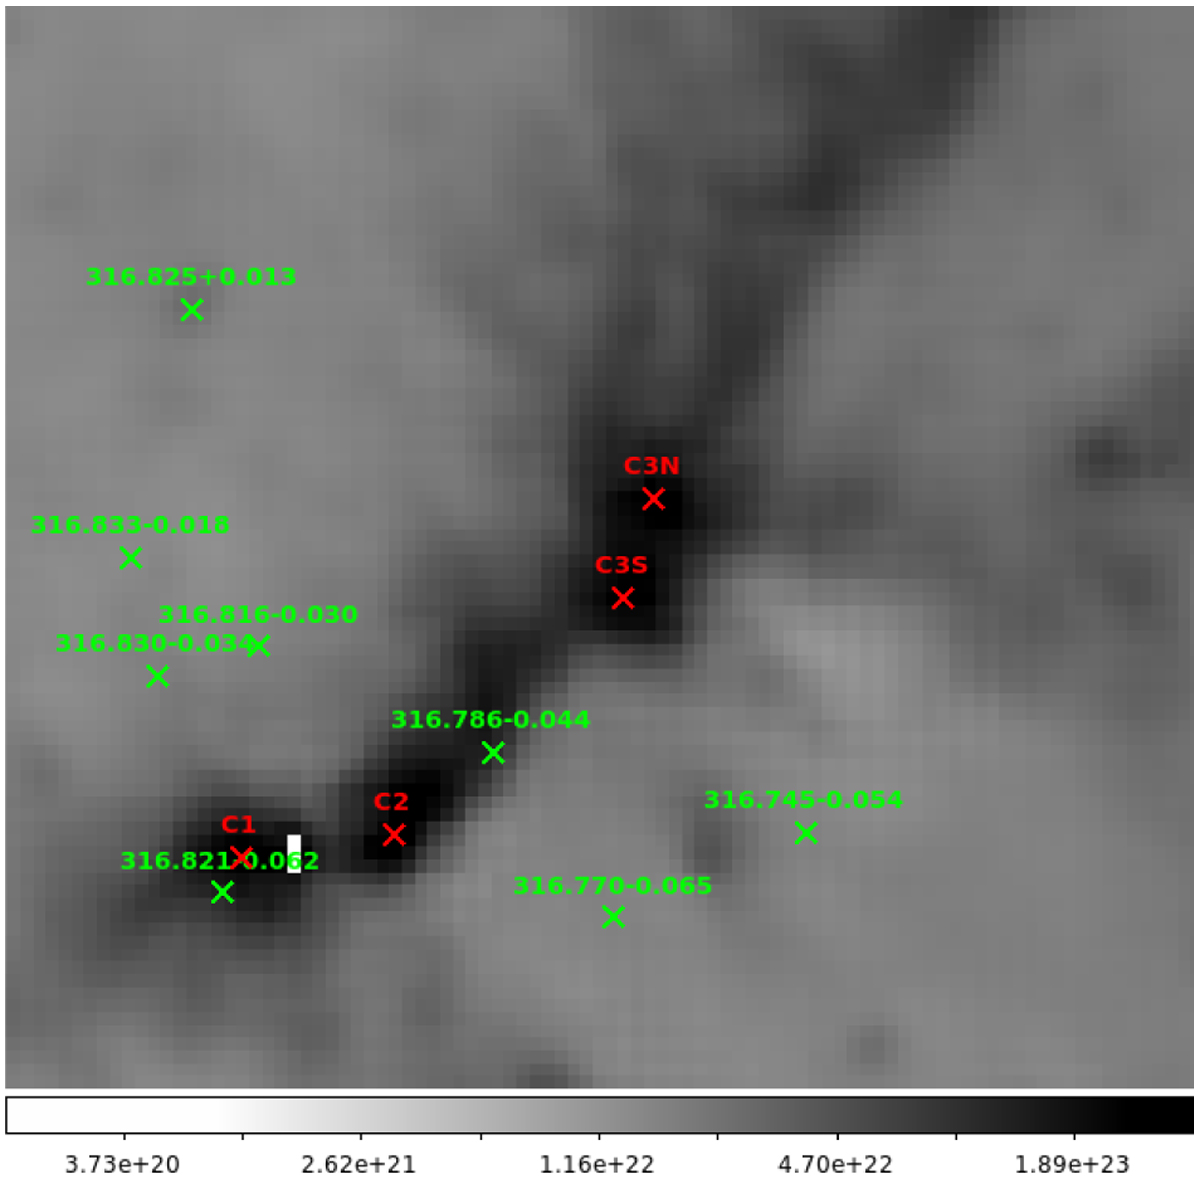
Positions (green crosses) of the IRDC fragments in the central area of G316.80–00.05. The underlying grey image is the column density map. The clump locations are shown in red crosses.
Current usage metrics show cumulative count of Article Views (full-text article views including HTML views, PDF and ePub downloads, according to the available data) and Abstracts Views on Vision4Press platform.
Data correspond to usage on the plateform after 2015. The current usage metrics is available 48-96 hours after online publication and is updated daily on week days.
Initial download of the metrics may take a while.