Fig. B.7
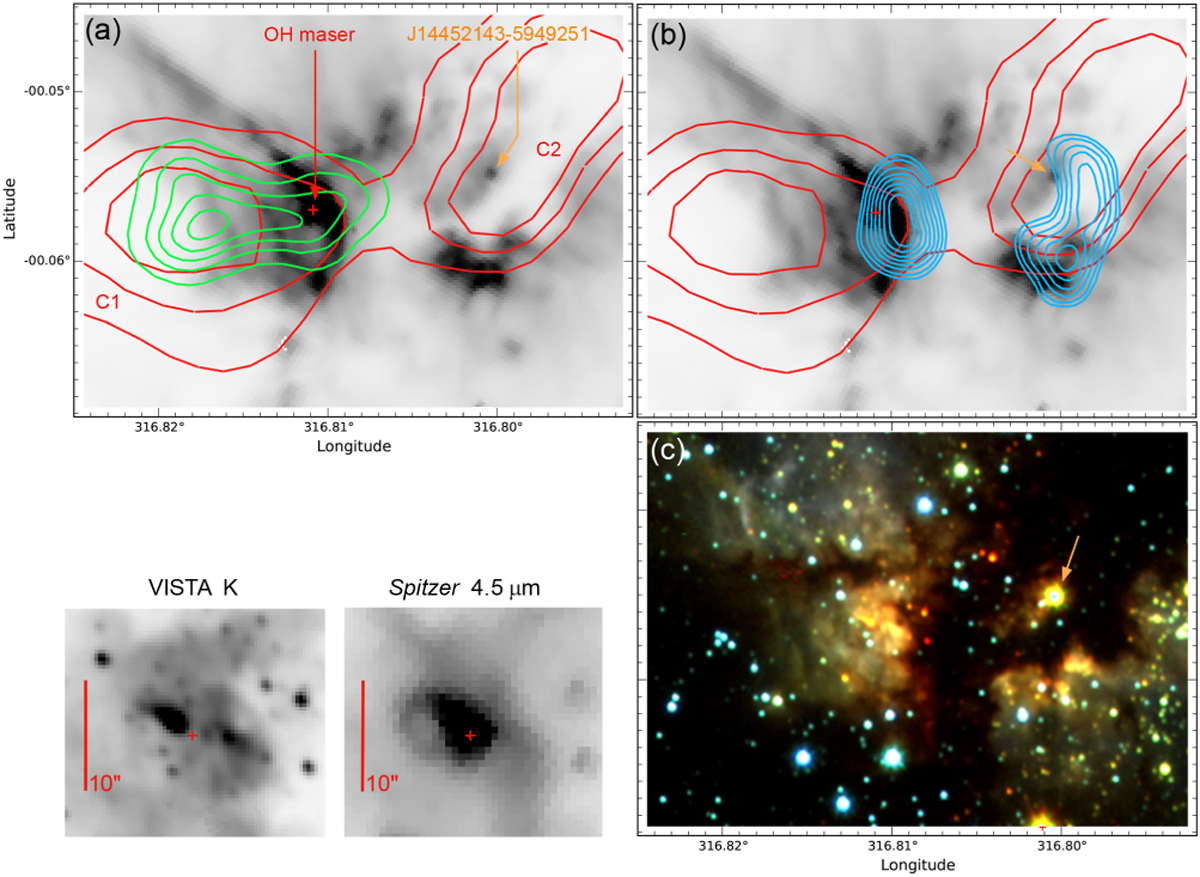
Vicinity of the first site of maser emission and the central region of the complex. The OH maser position isindicated by a red plus symbol. The orange arrow indicates the best candidate exciting star proposed by Vig et al. (2007). The red contours indicate the column density (levels of 1.0, 1.5, and 2.0 × 1023 cm−2). Panel a: green contours indicate the NH3 emission (Longmore et al. 2007, their Fig. 11); the underlying grey image is the Spitzer 8.0 μm image. Panel b: blue contours now indicate the radio-continuum emission at 24 GHz (Longmore et al. 2007). Panel c: composite JHKs colour image (VISTA images) showing the dark absorption features and the exciting star proposed by Vig et al. (2007). A zoomed view of maser site at 2.2 μm (VISTA) and 4.5 μm (Spitzer) is shown in the bottom-left panel.
Current usage metrics show cumulative count of Article Views (full-text article views including HTML views, PDF and ePub downloads, according to the available data) and Abstracts Views on Vision4Press platform.
Data correspond to usage on the plateform after 2015. The current usage metrics is available 48-96 hours after online publication and is updated daily on week days.
Initial download of the metrics may take a while.