Fig. B.1
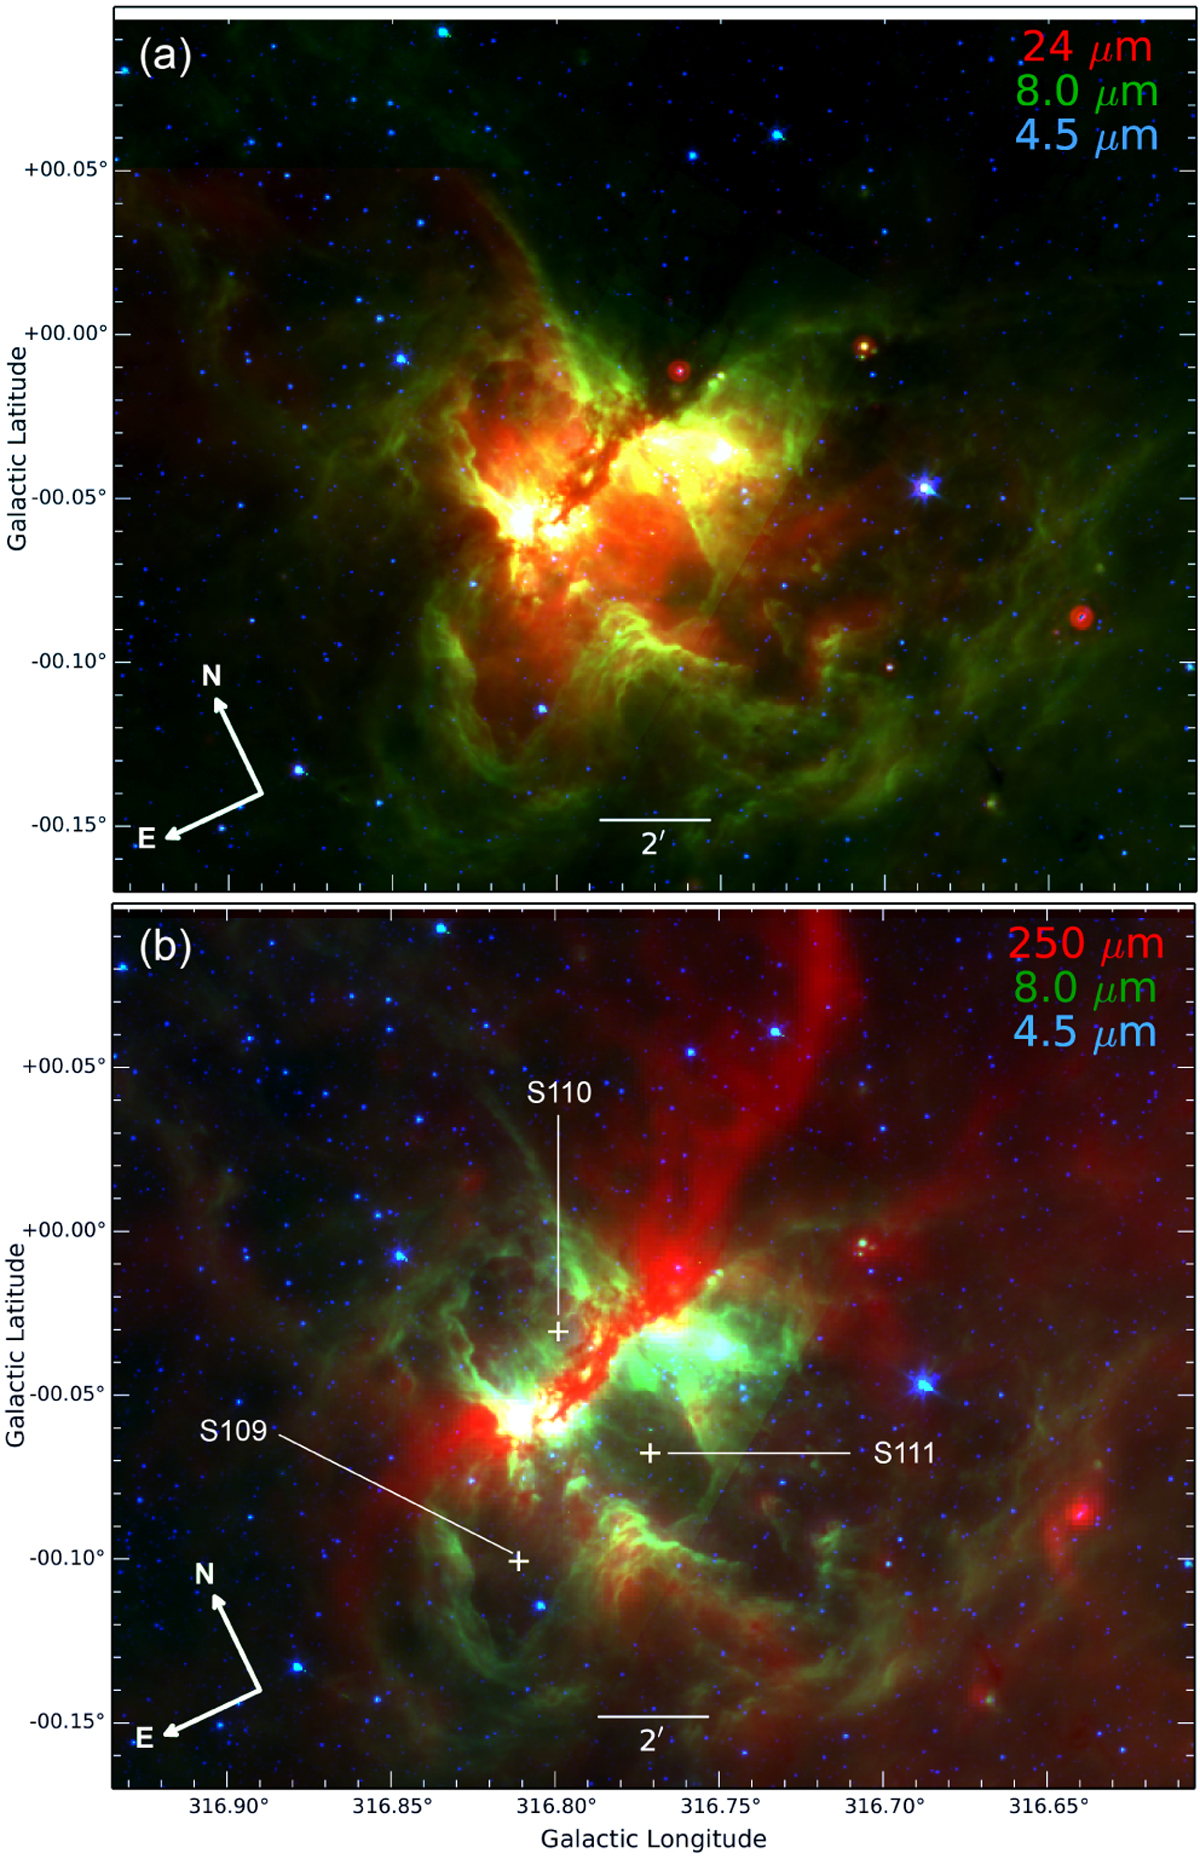
Bipolar nebula G316.80–00.05. Panel a: composite colour image of the G316.790-0.045 complex: red, green, and blue indicatethe Spitzer 24 μm, 8.0 μm, and 4.5 μm data, respectively (the 24 μm emission is saturated in the centre). Panel b: composite colour image of the complex: red is for the Herschel 250 μm emission showing the cold filament at the waist of the nebula, green is for the 8 μm PAH emission, blue is for the 4.5 μm stellar emission. The three bubbles listed in the (Churchwell et al. 2006) catalogue are identified.
Current usage metrics show cumulative count of Article Views (full-text article views including HTML views, PDF and ePub downloads, according to the available data) and Abstracts Views on Vision4Press platform.
Data correspond to usage on the plateform after 2015. The current usage metrics is available 48-96 hours after online publication and is updated daily on week days.
Initial download of the metrics may take a while.