Fig. A.6
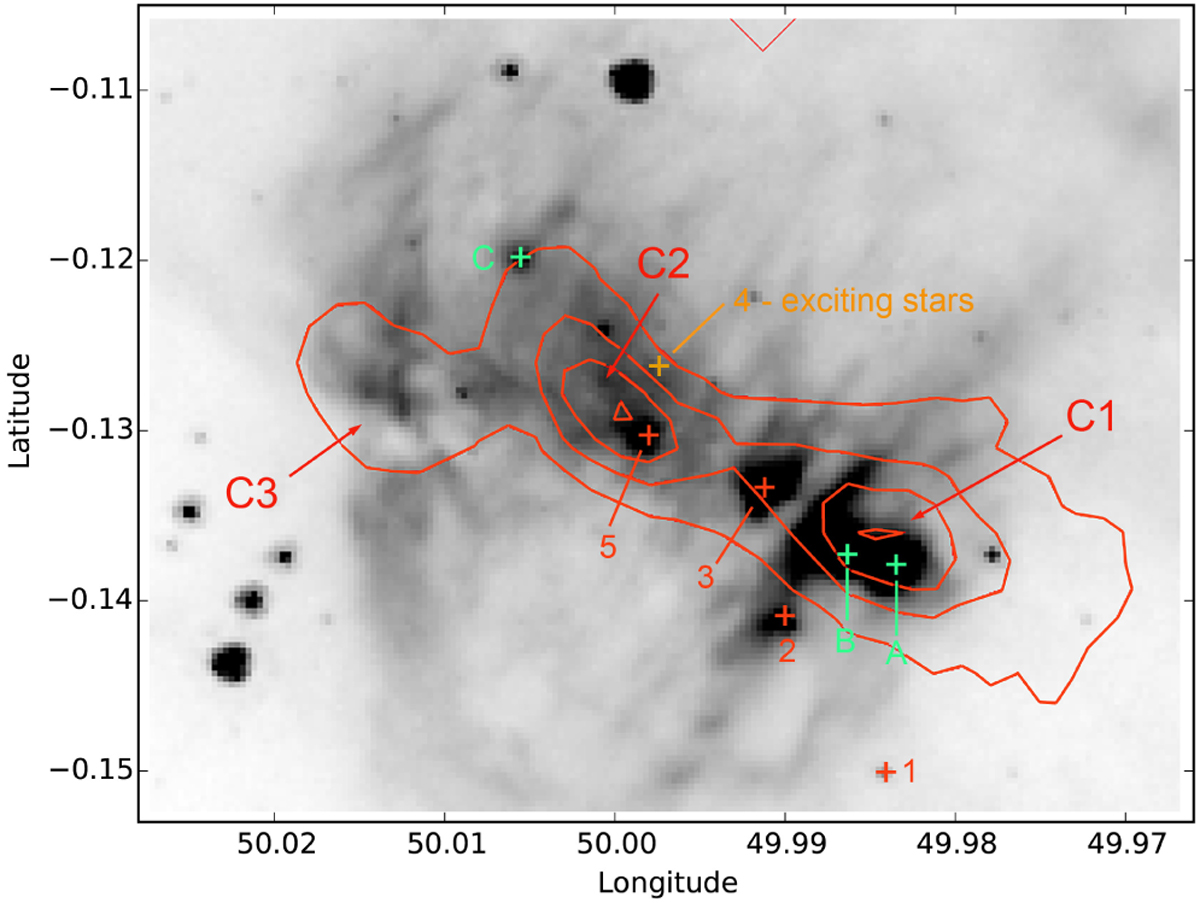
Spatial distribution of various sources in the field of G049.9977–00.1261 that are discussed in the text. The underlying grey image is the Spitzer 8.0 μm image. The column density contours are in red (levels of 2, 3, 4, and 5 × 1022 cm−2). The diffuse regions are identified in green, the YSOs in red, and the exciting stars in orange.
Current usage metrics show cumulative count of Article Views (full-text article views including HTML views, PDF and ePub downloads, according to the available data) and Abstracts Views on Vision4Press platform.
Data correspond to usage on the plateform after 2015. The current usage metrics is available 48-96 hours after online publication and is updated daily on week days.
Initial download of the metrics may take a while.