Open Access
Fig. A.1
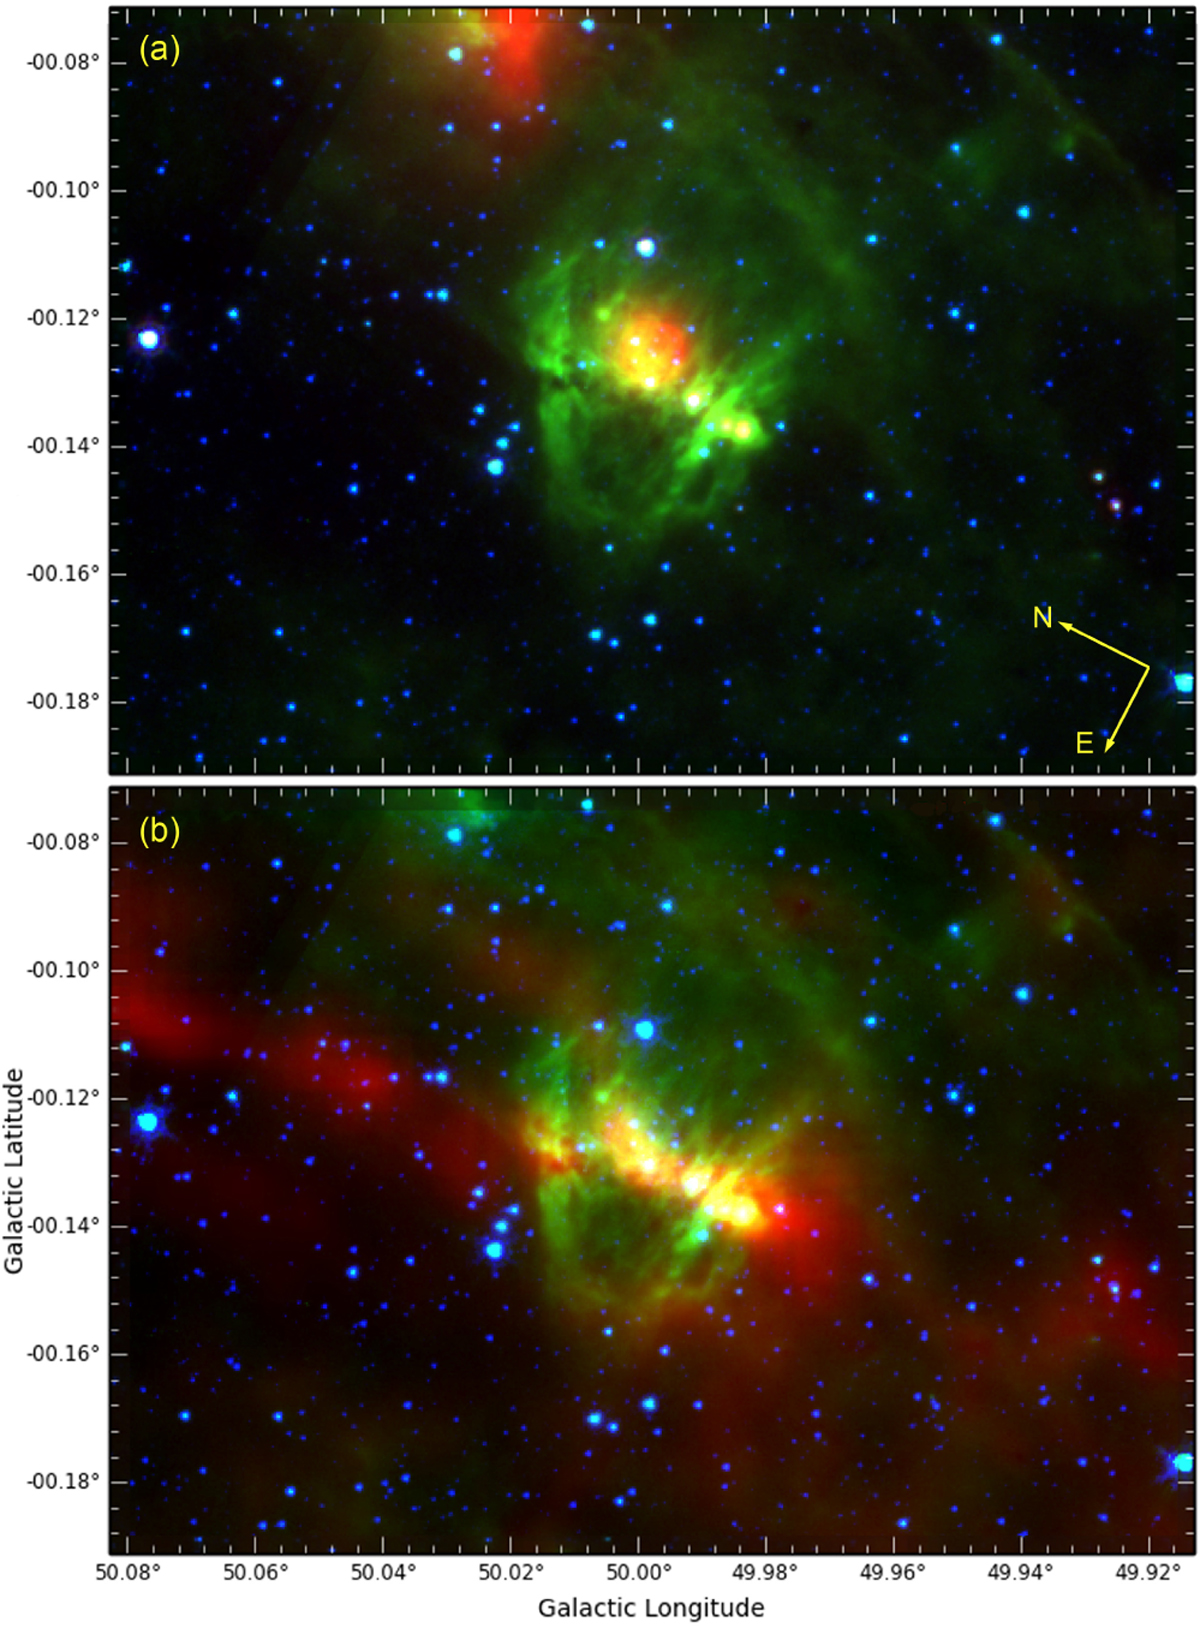
Bipolar nebula G049.99–00.13. Panel a: composite colour image with the Spitzer 24 μm, 8.0 μm, and 4.5 μm emission in red, green, and blue, respectively. Panel b: the red channel is now the Herschel column density map showing the parentalfilament.
Current usage metrics show cumulative count of Article Views (full-text article views including HTML views, PDF and ePub downloads, according to the available data) and Abstracts Views on Vision4Press platform.
Data correspond to usage on the plateform after 2015. The current usage metrics is available 48-96 hours after online publication and is updated daily on week days.
Initial download of the metrics may take a while.