Open Access
Fig. 10
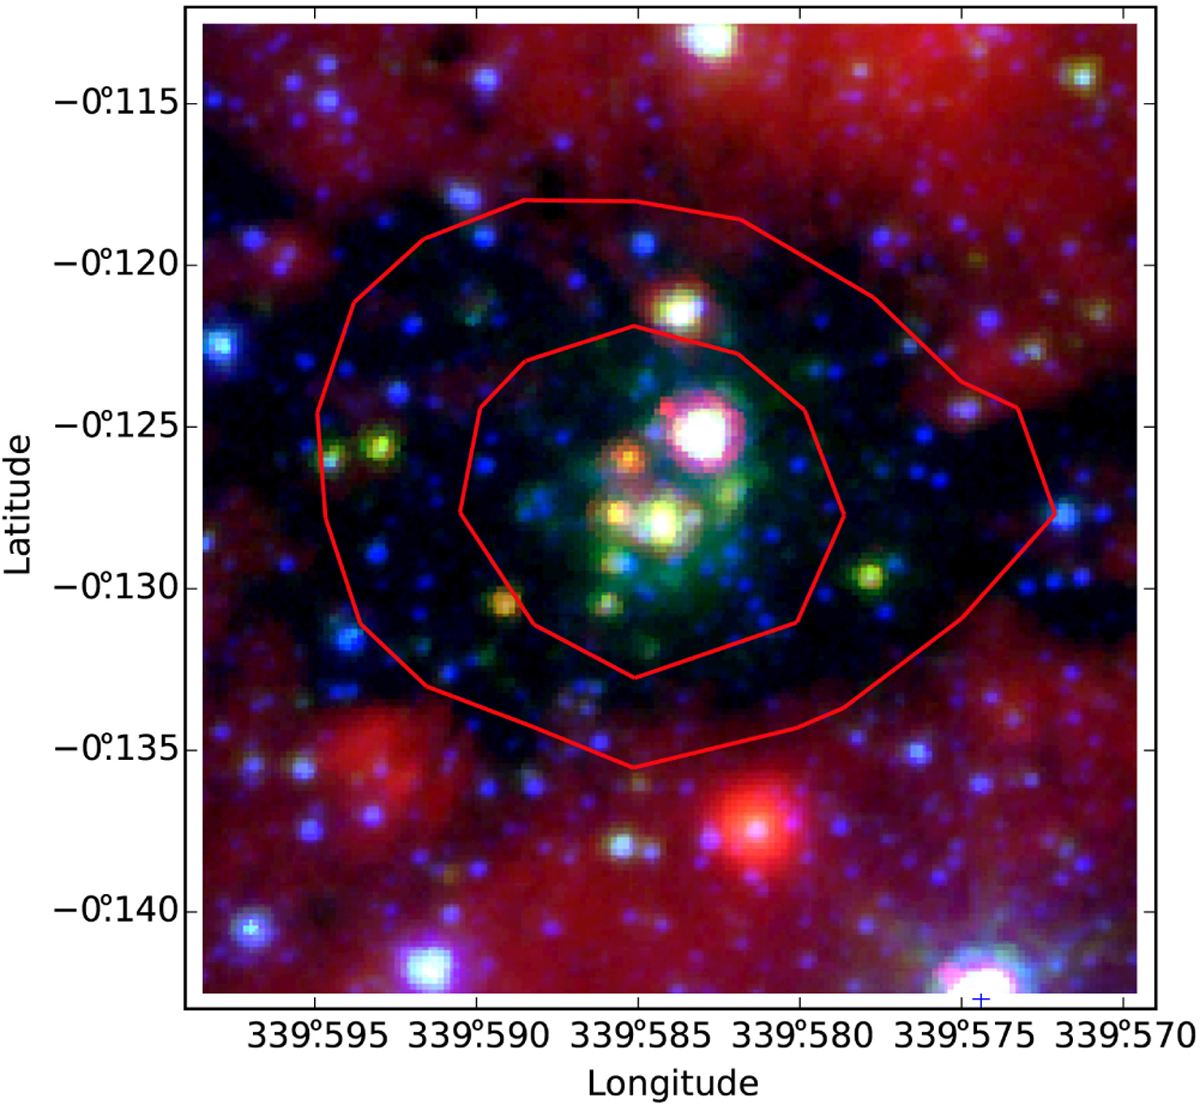
Colour composite image showing the second-generation cluster of G339.59–00.12. The image is made with Spitzer 8.0 μm (red), 4.5 μm (green), and VISTA Ks (blue) data. The red contours are for column densities of 0.5 × 10²³ and 1.0 × 1023 cm−2.
Current usage metrics show cumulative count of Article Views (full-text article views including HTML views, PDF and ePub downloads, according to the available data) and Abstracts Views on Vision4Press platform.
Data correspond to usage on the plateform after 2015. The current usage metrics is available 48-96 hours after online publication and is updated daily on week days.
Initial download of the metrics may take a while.