Free Access
Fig. 5
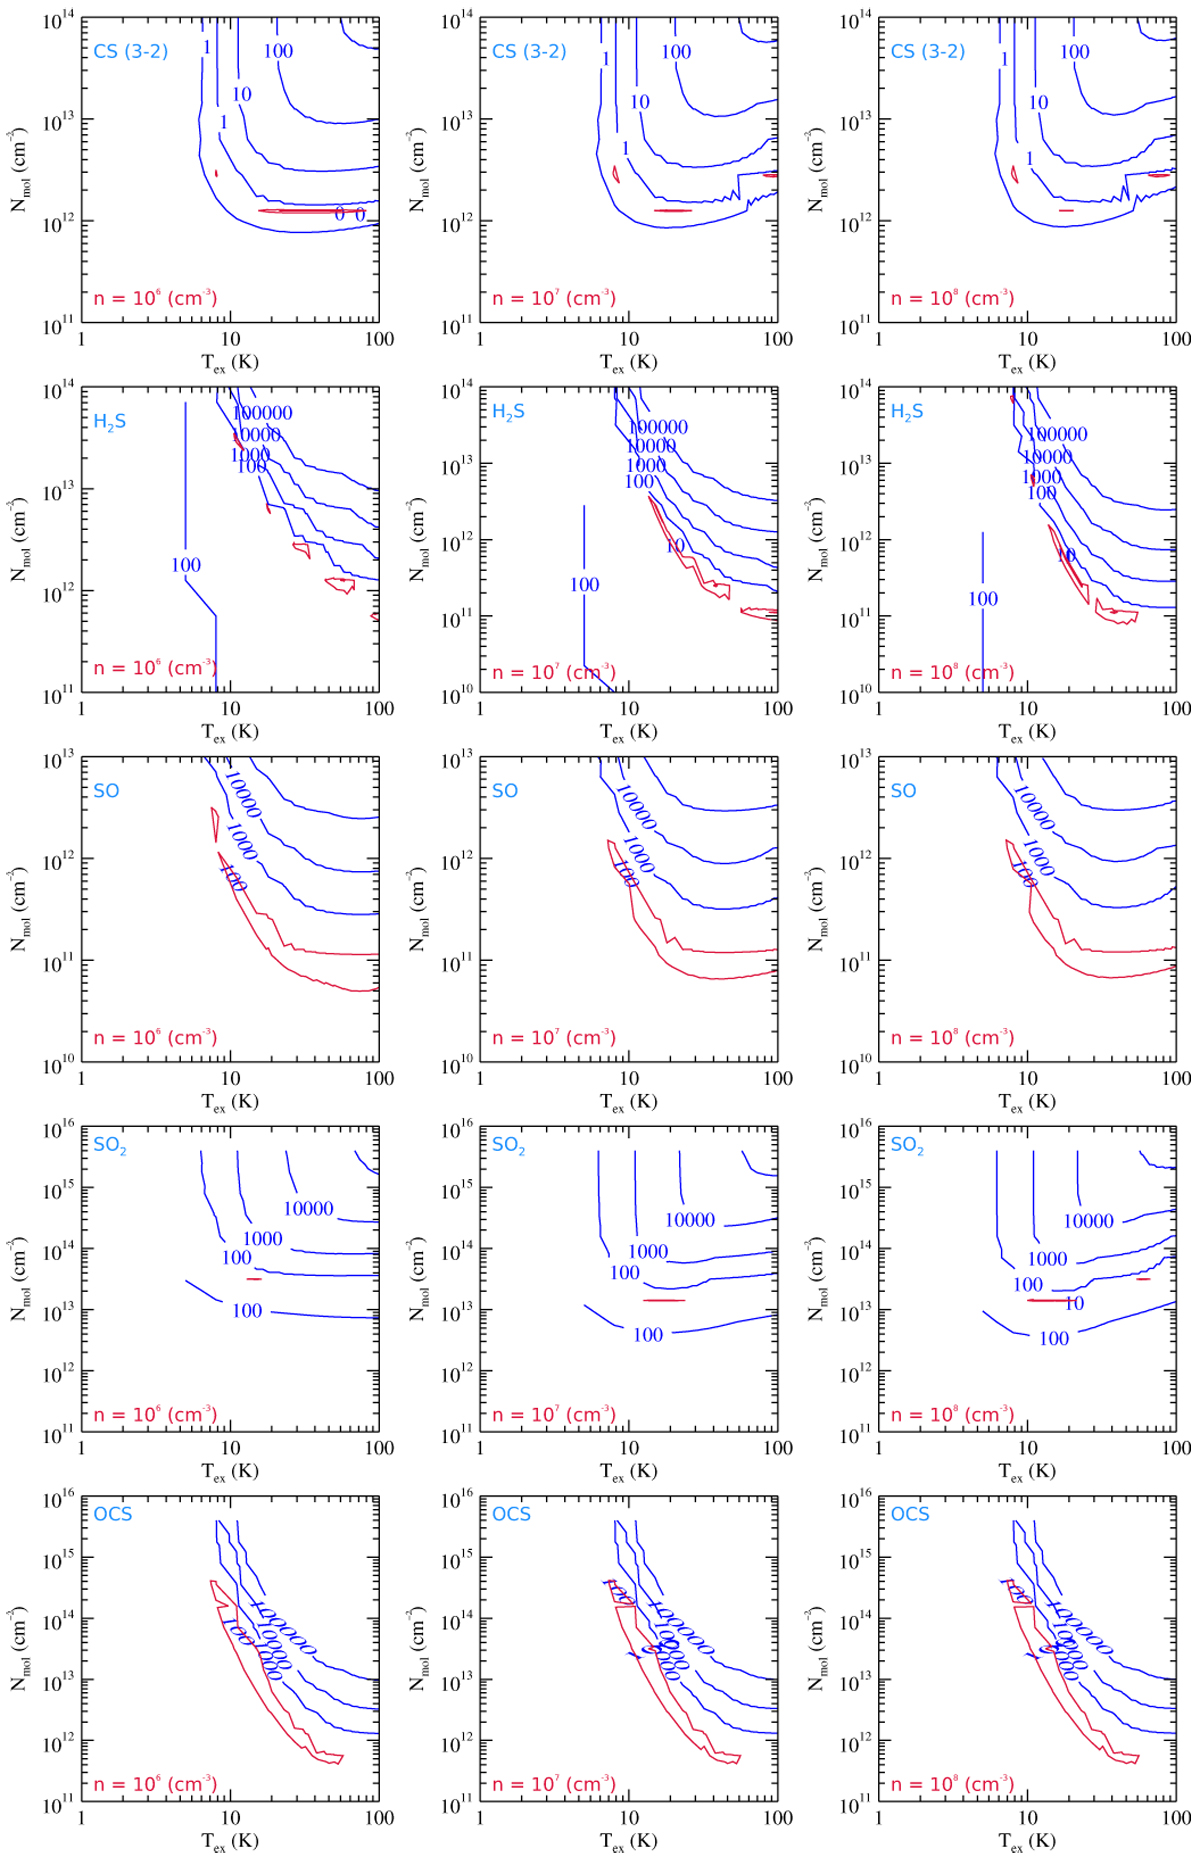
Computed χ2 distributionswith RADEX code for three volume densities of 106, 107, and 108 cm−3 and varied Tex and molecular column densities N. Top to bottom: results for CS, H2S, SO, SO2, and OCS aredepicted. The red contours indicate the χ2-minima.
Current usage metrics show cumulative count of Article Views (full-text article views including HTML views, PDF and ePub downloads, according to the available data) and Abstracts Views on Vision4Press platform.
Data correspond to usage on the plateform after 2015. The current usage metrics is available 48-96 hours after online publication and is updated daily on week days.
Initial download of the metrics may take a while.