Fig. 1
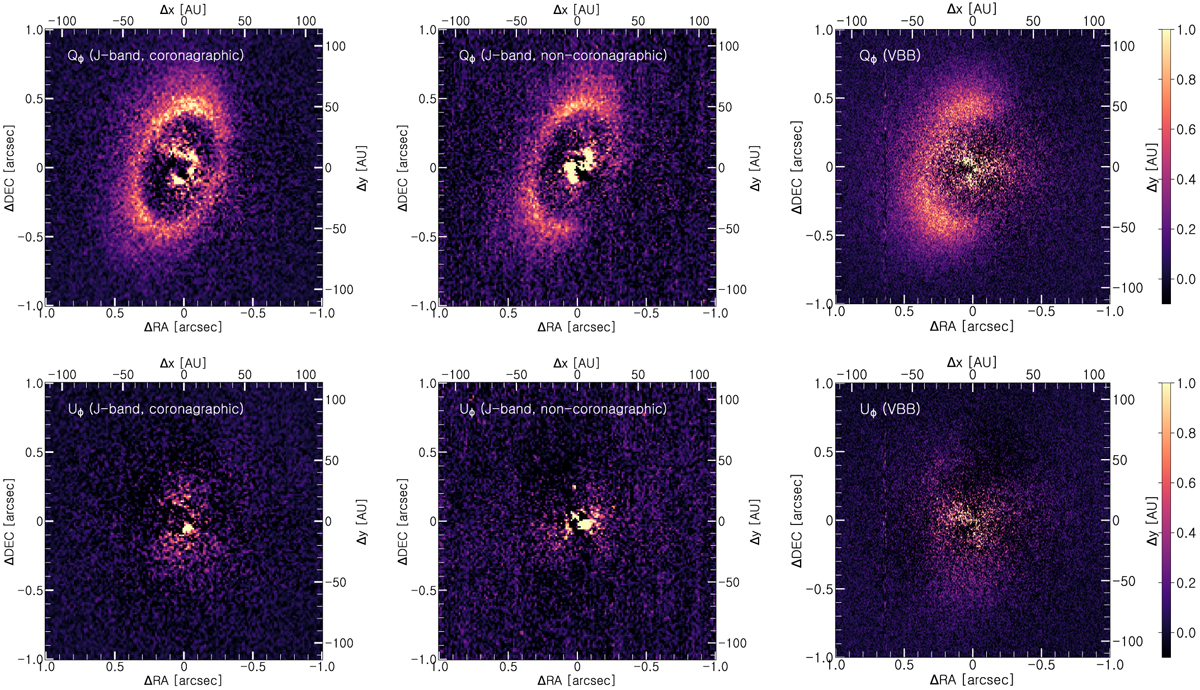
SPHERE PDI observations. Top row: Qϕ images; bottom row: Uϕ images. The left and middle columns correspond to the IRDIS J-band observations, taken with coronagraph (March 25, 2016) and without coronagraph (July 31, 2017), after correcting for the instrumental polarisation (IP) and subtraction of the central source polarisation. The right column presents the ZIMPOL observations (July 9, 2015). The colour scale was chosen arbitrarily but is the same for each pair of Qϕ and Uϕ. We note that negative values are saturated to enable a better visual contrast. North is up and east is to the left.
Current usage metrics show cumulative count of Article Views (full-text article views including HTML views, PDF and ePub downloads, according to the available data) and Abstracts Views on Vision4Press platform.
Data correspond to usage on the plateform after 2015. The current usage metrics is available 48-96 hours after online publication and is updated daily on week days.
Initial download of the metrics may take a while.