Fig. 4.
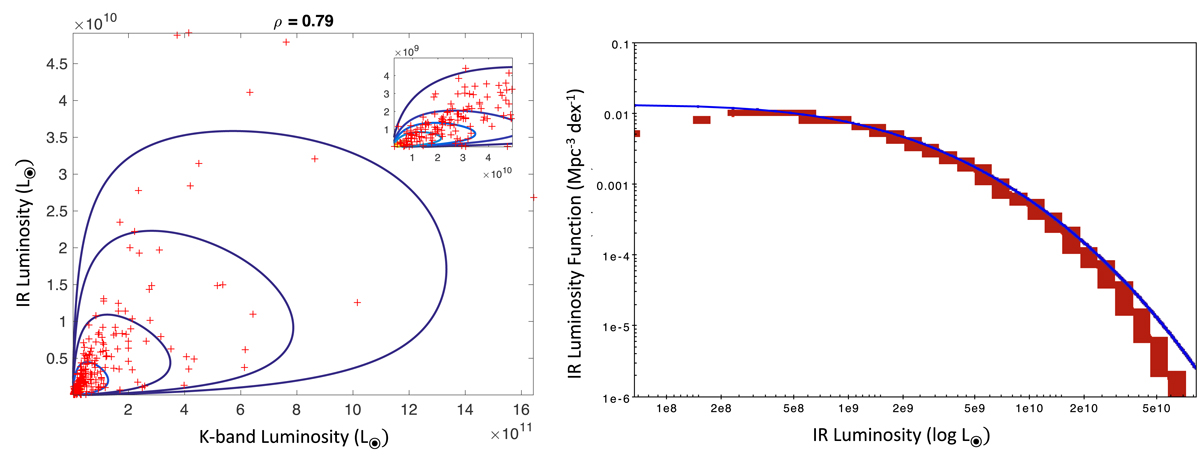
Panel a: bivariate PDF L(K)−L(IR) for LTGs only: estimated bivariate PDF shown in linear scale (and enlarged in the inset) for the K-band with the infrared luminosities. Contour lines correspond to levels 0.1, 0.3, 0.5, 0.7, and 0.9. These values correspond to the fraction of the peak value of the BLF that is set to one. Panel b: reconstructed IR luminosity function of the HRS sample (red line) shown together with the LF computed over local blind IR surveys (blue line) by Marchetti et al. (2016). Error bars are estimated through a bootstrapping technique.
Current usage metrics show cumulative count of Article Views (full-text article views including HTML views, PDF and ePub downloads, according to the available data) and Abstracts Views on Vision4Press platform.
Data correspond to usage on the plateform after 2015. The current usage metrics is available 48-96 hours after online publication and is updated daily on week days.
Initial download of the metrics may take a while.