Fig. 3.
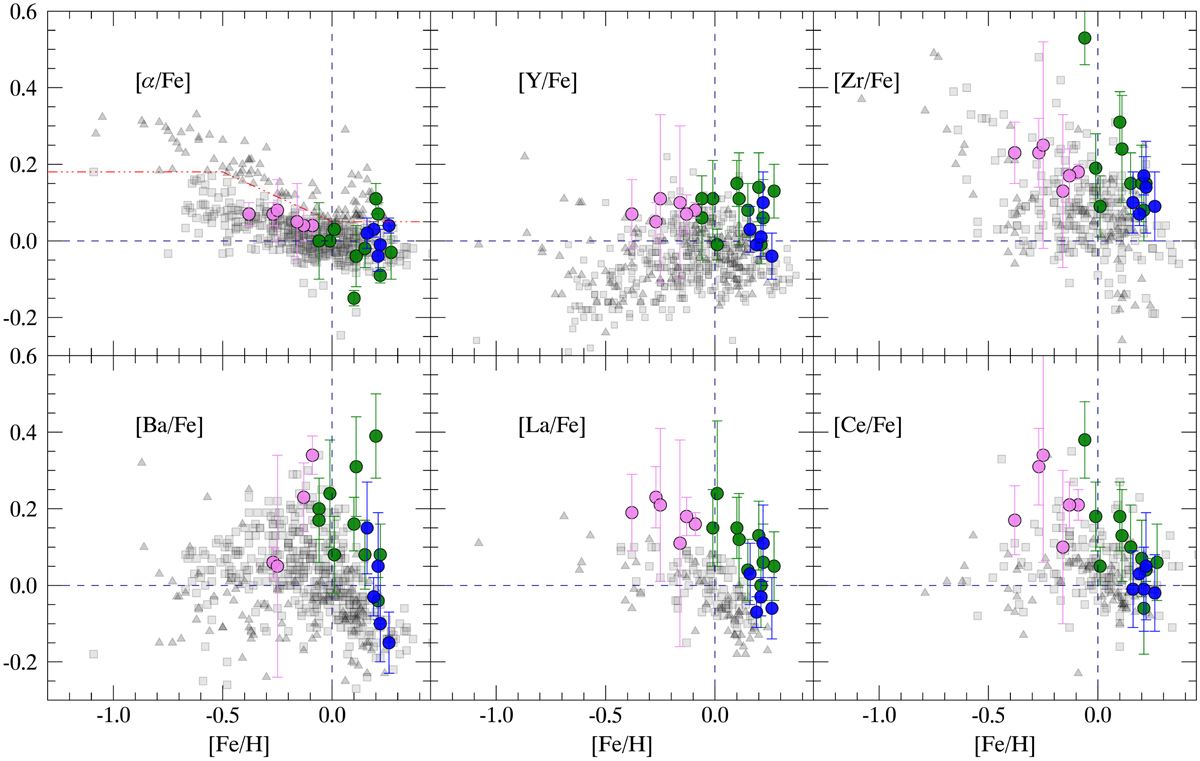
Abundance ratios [X/Fe] vs. [Fe/H] in member stars of clusters (large filled circles – in blue for clusters with RGC < 6.5 kpc, in green for clusters with 6.5 kpc < RGC < 9.5 kpc, and in violet for clusters with RGC > 9.5 kpc), in thin-disc stars (small grey squares) and in thick-disc stars (small black triangles). The blue dashed lines represent the solar values. The red dash-dotted line is the relationship of Adibekyan et al. (2011) which separates thin- and thick-disc stars.
Current usage metrics show cumulative count of Article Views (full-text article views including HTML views, PDF and ePub downloads, according to the available data) and Abstracts Views on Vision4Press platform.
Data correspond to usage on the plateform after 2015. The current usage metrics is available 48-96 hours after online publication and is updated daily on week days.
Initial download of the metrics may take a while.