Fig. 11.
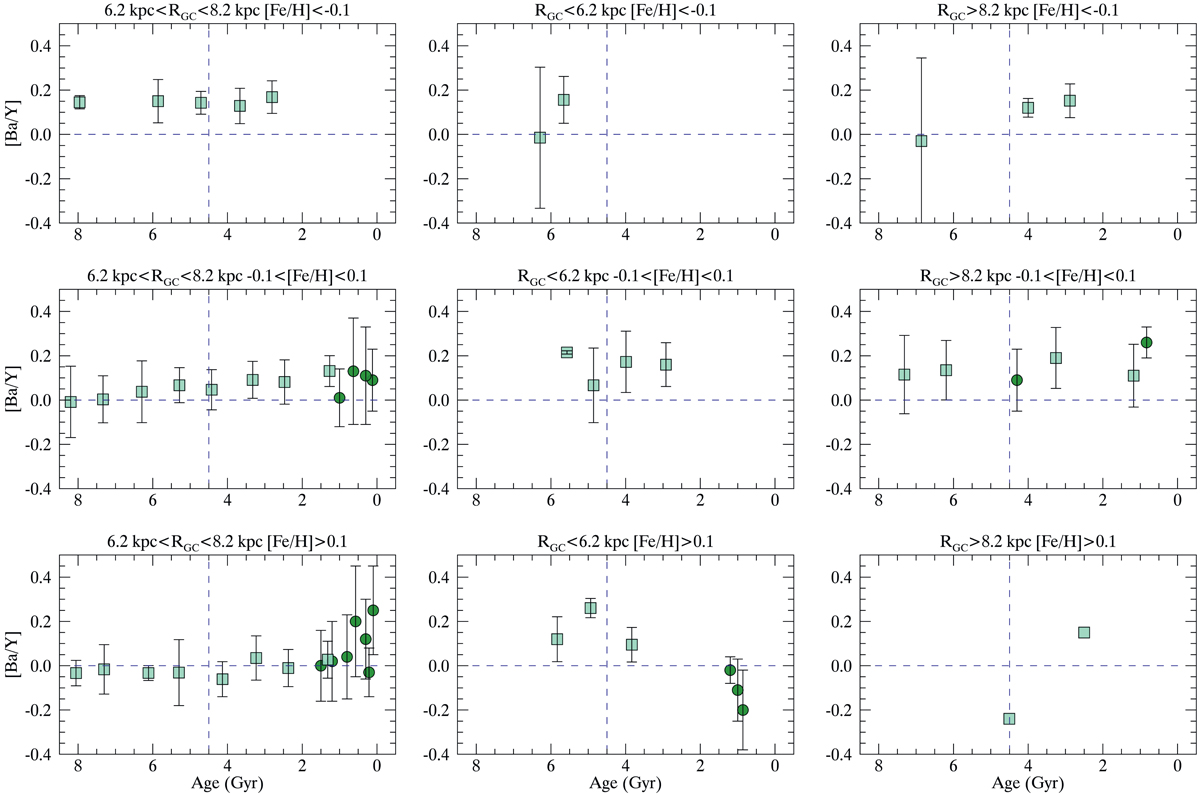
Abundance ratios [Ba/Y] vs. age in cluster and thin-disc stars (symbols as in Fig. 10) for the three radial ranges: 6.2 kpc < RGC < 8.2 kpc (left panels), RGC < 6.2 kpc (central panels) and RGC > 8.2 kpc (right panels). For each radial bin, we divide the plot into three metallicity ranges: below solar [Fe/H] < − 0.1 (panels in the upper row), solar −0.1 < [Fe/H] < +0.1 (panels in the central row) and super solar [Fe/H] > +0.1 (panels in the lower row).
Current usage metrics show cumulative count of Article Views (full-text article views including HTML views, PDF and ePub downloads, according to the available data) and Abstracts Views on Vision4Press platform.
Data correspond to usage on the plateform after 2015. The current usage metrics is available 48-96 hours after online publication and is updated daily on week days.
Initial download of the metrics may take a while.