Fig. 13
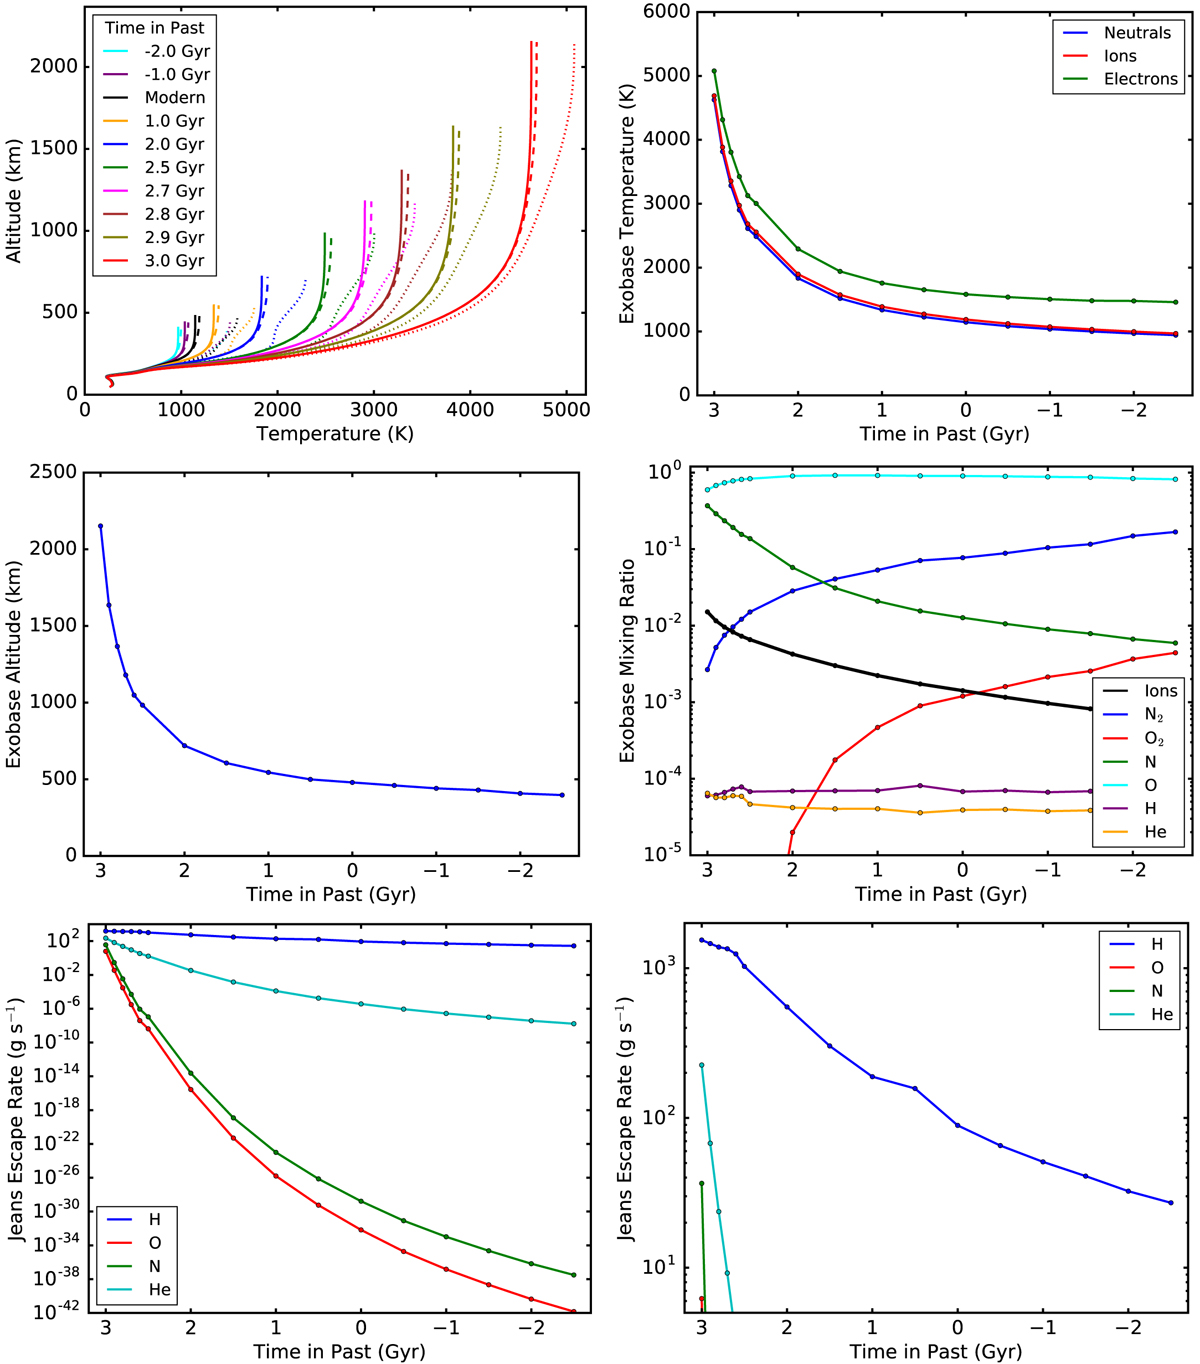
Our simulation results for the response of the Earth’s atmosphere to the evolving XUV spectrum of the Sun. In the upper left panel, we show the temperature structures for several of these models, where the different colours are for different ages and the solid, dashed, and dotted lines show the neutral, ion, and electron temperatures respectively. In all cases, the lines end at the exobase. In the upper right, middle left, and middle right panels, we show the exobase temperatures, altitudes, and chemical compositions as functions of age. In the lower left and lower right panels, we show the evolution of Jeans escape for H, O, N, and He, with the difference between the two plots being the range on the y-axis. In each figure, the small circles show the exact locations of each simulation.
Current usage metrics show cumulative count of Article Views (full-text article views including HTML views, PDF and ePub downloads, according to the available data) and Abstracts Views on Vision4Press platform.
Data correspond to usage on the plateform after 2015. The current usage metrics is available 48-96 hours after online publication and is updated daily on week days.
Initial download of the metrics may take a while.