| Issue |
A&A
Volume 617, September 2018
|
|
|---|---|---|
| Article Number | A79 | |
| Number of page(s) | 7 | |
| Section | Interstellar and circumstellar matter | |
| DOI | https://doi.org/10.1051/0004-6361/201832772 | |
| Published online | 18 September 2018 | |
Time-dependent spectral-feature variations of stars displaying the B[e] phenomenon
IV. V2028 Cygni: modelling of Hα bisector variability★,★★
1
Astronomical Institute, Charles University in Prague,
V Holešovičkách 2,
180 00
Praha 8,
Czech Republic
e-mail: This email address is being protected from spambots. You need JavaScript enabled to view it.
2
Institute of Theoretical Physics and Astrophysics, Masaryk University,
Kotlářská 2,
611 37
Brno,
Czech Republic
3
Astronomical Institute of the Academy of Science of the Czech Republic,
Fričova 298,
251 65 Ondřejov,
Czech Republic
4
Canada-France-Hawaii Telescope Corporation,
65-1238 Mamalahoa Hwy,
Kamuela HI 96743,
USA
Received:
5
February
2018
Accepted:
4
July
2018
Abstract
We present an alternative model of V2028 Cyg, a B[e] star of FS CMa type. The star V2028 Cyg is atypical among FS CMa stars due to its composite spectra of B4III and K2II-Ib type. Our modelling of the temporal variability of the Hα line bisectors indicates as the most probable model a geometrically and optically thick disc, which is surrounded by a dusty ring seen almost edge-on. This provides a possibility that the K-spectral component is formed in the disc.
Key words: stars: emission-line, Be / stars: mass-loss / accretion, accretion disks / binaries: spectroscopic / stars: individual: MWC 623
Based on data from Perek 2 m telescope, Ondřejov, Czech Republic.
Based on observations obtained at the Canada-France-Hawaii Telescope (CFHT), which is operated by the National Research Council of Canada, the Institut National des Sciences de l’Univers of the Centre National de la Recherche Scientique of France, and the University of Hawaii. The observations at the Canada-France-Hawaii Telescope were performed with care and respect from the summit of Maunakea, which is a significant cultural and historic site.
© ESO 2018
1 Introduction
The star V2028 Cyg (MWC 623) shows the B[e] phenomenon – the presence of forbidden emission lines of neutral or singly ionised atoms and infrared excess that is attributed to hot dust. The lines from the permitted transitions are observed in emission, absorption, or show a complicated structure. The Balmer lines are very intense, especially the Hα line. The continuum has the shape of a B-type star. Such spectral properties could be found among supergiants, Herbig Ae/Be stars, compact planetary nebulae, and symbiotic stars (Lamers et al. 1998). However, V2028 Cyg does not belong to any of these four original groups. It is a member of the FS CMa group, introduced later by Miroshnichenko (2007).
The evolution stage and at least a rough model of the original four groups has been set. However, this is not the case for FS CMa stars. Their origin and nature is still puzzling. One can even speak about the FS CMa paradox: the amount of circumstellar matter around FS CMa stars is so huge that it is impossible to be explained by the evolution of a single star. The simplest explanation provides the binary nature of these stars but an insufficient number of binaries has been found. The results of Carciofi et al. (2010) pointed to this problem; they determined a mass-loss rate (Ṁ) of IRAS 00470+6429 between 2.5 and 2.9 × 10⁻⁷ M⊙ using Monte-Carlo radiative transfer calculations. This value of Ṁ is about two orders of magnitude larger than the Ṁ of main-sequence B-type stars (10−10−10−9 M⊙) and one or two orders of magnitude smaller that for B[e] supergiants.
The binarity of FS CMa stars is discussed in detail in Miroshnichenko & Zharikov (2015). They point to 14 stars that show signatures of binarity. Periodic radial velocity (RV) variations were found for only two of them – CI Cam (19.4 ± 4 d; Barsukova et al. 2006) and MWC 728 (Miroshnichenko et al. 2015), although CI Cam may not be a FS CMa star. MWC 728 remains the only FS CMa star where the orbital motion was detected. Forty-four observations taken between 2004 and 2015 show the period of 27.5 days. Unfortunately, the used data suffer from poor time sampling, since the spectra were taken mostly during short observing runs. To better determine the period, more data are necessary. Two other stars from the list (AS 174 and FX Vel) show Li I 6708 and Ca I 6717 Å, which is the signature of a cool component (Miroshnichenko et al. 2007). The indication of the binary nature of IRAS 17449+2320 lies in the specific line profiles (Sestito et al., in prep.).
The binarity of IRAS 00470+6429 and IRAS 07080+0605 is suggested based on a large Hα emission, which indicates a large Ṁ. However, Ṁ is the quantity that cannot be determined from the spectra directly. To do this, a model and synthetic spectra have to be used. Currently, there are no models that sufficiently describe the situation. The strong Hα emission is a disputable indicator of Ṁ. In the conditions of very sparse, extended, and slowly moving media, which is observed in B[e] stars, very intense Hα emission can also arise from very small Ṁ. The stars FS CMa, HD 50138, and HD 85567 were proved to be binaries based on spectro-astrometric measurements by Baines et al. (2006). However, the shift of the Hα centre in the transversal direction on the CCD chip was small in these cases.
The star V669 Cep was assumed to be a binary based on the similarity of its spectra with V2028 Cyg (Miroshnichenko et al. 2002), which shows a composite spectrum of B4III and K2II-Ib type (Zickgraf 2001). This is the strongest evidence of binarity among FS CMa stars. However, the presence of the lines forming in a cooler media in such an extended circumstellar matter may not be a signature of just a stellar companion. It can reflect the temperature decrease of the matter. Also absorption lines can be detected if they originate from an optically thick disc, forming a pseudo-atmosphere.
Another difficulty in the investigation of the binarity of FS CMa stars is the complicated behaviour of their variability. Their multi-periodicity, quasi-periodicity, or even chaotic behaviour has to be taken into account (Kučerová et al. 2013; Jeřábková et al. 2016). New observations by de la Fuente et al. (2015) suggest that some FS CMa stars could be post-merger systems. Another question is, if these stars are binaries, what is the effect of binarity on observed spectral properties?
To answer these questions and clarify the above-mentioned contradictions, our long-term observations (Polster et al. 2012) and the peculiar shape of the Hα line of V2028 Cyg can be used, because they allow a specific technique to be employed in the investigation of V2028 Cyg: the comparison of the observed and calculated temporal variability of the Hα bisectors, equivalent widths (EW), and line intensities. The present work is based on a set of purely geometrical models with an assumption of an optically thin or slightly opaque medium. The various physical processes, which could take place in FS CMa stars, are described by a set of free parameters. This technique can be applied in this particular case, because i) the assumption of an optically thin or slightly opaque Hα line is reasonable for V2028 Cyg, ii) the changes of relative quantities caused by the motion are compared with the observations, iii) the aim of the work is to narrow the set of possible geometrical configurations to enable further physically consistent modelling. The detailed justification of this approach is in the following sections.
2 Spectral properties of V2028 Cyg
We describe in brief the spectrum of V2028 Cyg because its specific properties, together with the observed variability, allow us to use the described technique. Besides narrow absorption lines of the cold component, V2028 Cyg distinguishes itself from other FS CMa stars by the single-peaked emission of Balmer lines up to high members (Hη, e.g., Canada-France-Hawaii Telescope, 3 July 2007, spectrograph ESPaDOnS, P.I. N. Manset). In contrast to this, other FS CMa stars are typified by double-peaked Hα emission, followed by other members of the Balmer series which are, at least partially, in absorption. The width of Balmer lines decreases with increasing principal quantum number. This behaviour is also shown by V2028 Cyg. The wings of the Hα line extend to approximately ± 400 km s−1, while the Hϵ wings reach only ± 120 km s−1. The Pashen series is in the emission up to high members (n = 21). The He I line 6678 Å is very narrow (about ±80 km s−1), fully in absorption, and stable on the timescale of years. Other FS CMa stars usually show night-to-night variability of this line, line broadening about ± 200 km s−1, and line-profile changes from pure absorption to pure emission through absorption with emission wings. Other He I lines (singlets 3964, 4143, 4922, and 5016 Å, and triplet 3888 Å) are in emission, which also is very unusual amongst FS CMa stars. The He I 5876 Å line is almost undetectable, as is the nearby Na I resonance doublet D1, D2, and the near UV Ca II K resonance line 3933 Å. These resonance lines almost always show symmetric emission as other FS CMa stars. The spectral properties of V2028 Cyg suggest that we are dealing with an anomalous star with a complicated structure, however, specific approaches could be used.
3 Bisector modelling
The creation of a consistent model of B[e] stars is a very complicated task. Multi-dimensional time-dependent hydrodynamics together with non-LTE radiative transfer need to be solved. Moreover, the situation is complicated by the fact that the B[e] phenomenon is present in different types of objects: supergiants, compact planetary nebulae, Herbig Ae/Be stars, and symbiotic stars (Lamers et al. 1998). Several physical effects can be responsible for the B[e] phenomenon. Since B[e] stars show significant time variability, the observed kinematic properties can be used to narrow the range of possible solutions. A good knowledge of the system geometry and properties are essential for detailed calculations based on a physically consistent model.
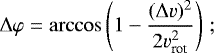
To determine the structure of the circumstellar material around V2028 Cyg, we used 88 spectra obtained at the Ondřejov 2 m telescope, Czech Republic, during our campaign from 1 December 2004 to 8 October 2010 (for more details see Polster et al. 2012). We focused on the Hα line, because it is purely in the emission, is single-peaked, and is only slightly asymmetric. Such a Hα shape is unique among FS CMa stars and indicates that we are dealing with a special case, where the assumption of the optically thin Hα line is not too far from the reality. We used the opportunity presented by this fact and constructed a set of kinematical models to describe the variability of the bisectors (see Fig. 1), EWs, and the line intensities. The optically thin kinematical models allow us to investigate various system configurations because it is easy to adapt the geometry by a set of simple parameters and the calculations are fast. The criteria of the suitability of individual solutions are strictly set by observations (Polster et al. 2012):
The line profile has a red-shifted peak;
Radial velocities and bisectors vary differently in the wings and the peak;
The absolute value of the EW is correlated with the maximum flux I;
The absolute value of |EW| is anti-correlated with the radial velocity vrw of the wings (Polster et al. 2012; Fig. 3 and 10).
We investigated several model configurations, whose common properties and assumptions are as follows:
The spherical coordinate system is chosen. The zero point of the system is identical with the centre of the star, which is eventually the primary star for the model described in Sects. 3.2 and 3.3. The axis θ = 0 corresponds to the rotation axis of this star. If the disc is present, its central plane is identical with the equatorial plane θ = π∕2. The direction ϕ = 0 points to the observer.
A Gaussian profile representing emission or weak absorption arises in each cell.
The parameter σ of each Gaussian is determined by the thermal broadening given by the temperature of the actual cell. The central position is shifted according to the cell velocity.
No atomic properties and level populations are included. The intensity arising in the given cell is taken in a rough, approximated manner and depends on the matter density and density of the radiation field from the central star. The density of the matter changes according to the equation of continuity. The radiation field density drops with r2 (r is the distance from the star centre).
Continuum radiation is neglected, or taken into account in an approximate manner.
This “artificial” intensity is integrated along the line of sight and the frequency shift caused by the global motion is taken into account. A negative value of the intensity is assumed for the regions with a weak absorption. The final line profile is obtained by integration along the visible surface.
-
The size of individual cells is determined by the velocity field gradient specified in the current model. The size of each cell is restricted by the maximum velocity dispersion in the cell (Δv). It is set to be smaller then σ∕4. Parameter σ stands for the half-width of the Gaussian emission profile arising in the cell. The cell size in the radial direction is
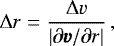 (1)
(1)where r is the radial distance from the centre.
This restriction on the size of the cells enables straightforward integration and avoids the use of the Sobolev approximation, which in complex three-dimensional (3D) geometry becomes ineffective due to the very complicated structure of Sobolev surfaces. Moreover, it fails in the description of accelerated layers, which are decelerated even until standstill far from the star as was observed by Kučerová et al. (2013) for another FS CMa star.
A β-velocity law (e.g., Lamers & Cassinelli (1999) for hot radiatively driven wind, and Ivezić & Elitzur (2010) for radiatively driven dusty wind) is used to describe the speed of outflowing material,
 (2)
(2)
where v∞ is the terminal velocity and R⋆ stellar radius.
The definition of the density, temperature, and velocity distribution is described in the following subsections dedicated to individual models. Such a constructed model is more mathematical and only roughly follows the physical properties of the envelope. No radiative transfer is solved. The intensity summing along the line of sight can be done only on the assumption of optically thin media. This is indicated by the profiles of metal lines from the hot component, since they are purely in emission and no absorption features have been observed. The situation is more complicated in the Hα line, since itis usually formed through a large area. A central absorption is present in this line, however, it is very small. Considering the above, the circumstellar media must not be very optically thick in the regions where the emission line is formed.
The validity of such a model is justified by the purpose of its usage. No physical parameters (Teff, ρ, log g, …) are found. Only the kinematical properties of the models are investigated. The comparison of the observations and the model is performed only through the time variability of the relative quantities – position of the Hα line bisectors (Fig. 1), EWs, and line intensities. Considering the previous analysis of observations and current theoretical models of B[e] stars we investigate models of i) a disc structure with a spot or a spiral arm, ii) a symbiotic star, iii) a cold star with a spherical wind and a companion, and iv) a disc with a dusty ring.
 |
Fig. 1 Hα profile of V2028 Cyg obtained with the Ondřejov 2 m telescope (R ~ 12 500) on 24 May 2005. The line bisector is plotted by the solid grey line and its values at different levels used for comparison of the model and observations are depicted by the black crosses. |
3.1 The rotating decretion disc with a spot or an arm
The first series of models (Fig. 2) assumes a hot star with a rotating disc, where the material outflow can be present. Discs around FS CMa stars are geometrically very extended; for example, Carciofi et al. (2010) determined the size of the gaseous disc to be around 100 R⋆. It is highly probable that such discs are not homogenous. Therefore we first constructed models where the asymmetry of the line profile is mainly caused by the presence of a spot or a spiral arm in the disc. The hot corona, polar wind, or jets are alternatively included. The properties of these models are as follows:
Emissivity in the disc decreases with r2;
-
Temperature in the disc decreases with the free parameter t
 (3)
(3)where T0 is the temperature at the inner radius of the disc;
-
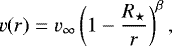
Rotation velocity of the disc is
 (4)
(4)where
 is the value of the critical rotation at the stellar equator. We performed tests for two particular values of the parameter j describing the different mechanisms of the disc formation. The conservation of the angular momentum is described by j = 1 and j = 1∕2 corresponds to the Keplerian rotation, which has been proved by Meilland et al. (2007) to take place in the discs of classical Be stars;
 The outflow of the material in the disc follows the β-law (Eq. (2)). We tested the models with the parameter β in the range between 1.5 and 3 and v∞ = 120 km s−1. Such a slow wind speed is predicted by for example Curé (2004);
-
The spiral arm or spot are simulated as regions of a higher density and temperature. The shape of the spiral arm is approximated by
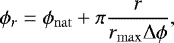 (5)
(5)where ϕnat is the angle of the turning at the inner disc boundary, rmax is the distance of the outermost part of the arm from the star, and Δ ϕ is a free parameter controlling the arm closure. Its value of one describes the situation where the angle difference between the origin of the spiral arm and its outermost part is π. The size of the spot and the opening angle of the spiral arm are free parameters. The speed of these structures can correspond to the rotation of the disc, but can also be different. Optionally, oscillations of the structures in both radial and azimuthal directions are permitted. Oscillations are simulated by changes of the size of the structure in the following line-profile calculations. As a part of the whole cycle, one can examine the possible growth or disappearance of structures;
The speed of the polar wind is described by the β-law (Eq. (2)). The terminal velocity in this region is about an order of magnitude higher than in the disc. The opening angle of the polar wind is a free parameter, which allows the description of the coronal region as well as a highly focused cone;
The axis of the jet symmetry can coincide with the rotation axis, but alternatively can be shifted to describe the geometry similar to the β Lyr system (Harmanec 2002) (Fig. 2, bottom right panel);
The size of the cell in the azimuthal direction is
 (6)
(6)We adopt the parameters of the central B-type star M⋆ ~ 7 M⊙, R⋆ ~ 7.5 R⊙ from Zickgraf (2001). We assume an isothermal disc, whose density decreases with the distance from the star as r−2. The size of the disc varies from 10 to 50 R⋆, and its full opening angle varies from 10° to 30°. Such a disc size (50 R⋆) allows us to describe the rotation periods up to 300 days in the case of Keplerian disc. However, real gaseous discs could be larger. However, once the radius of the central star in comparison to the disc size becomes sufficiently small, the bisector variability (Fig. 3) shows the same behaviour. Therefore, it is not necessary to investigate larger discs in this case;
We calculated the bisector variability for several inclination angles. The presented results (Fig. 3) are for i = 40°.
The radial velocity and bisector variations of the line wings of a spot are caused by the orbital motion of the hot star in the binary system. The spiral arm affects both the wings and the peak. In both cases (a spot and a spiral arm) it is possible to gain an asymmetric line profile and different radial velocity minima for the peak and wings. On the other hand, the peak shifts symmetrically blueward and redward relative to the line centre. This variation does not agree with the observed one, which always shows a redshift of the peak.
The asymmetry of the profile suggests the idea of a spot or an arm oscillating around some fixed azimuthal angle φ0 in the disc. It gives radial velocity and bisector variations in the peak and due to the appropriately chosen φ0 the redshift is granted. An oscillating spot or arm can represent the case of a slow wind from the cool companion focused by the hot compact component. The focused structure is unstable and oscillates. The resulting bisectors, however, do not fit with the observations (Fig. 3).
There is no mechanism that would cause an observed anti-correlation between radial velocity and |EW| curves. Alsoit is not possible to determine from the observations whether the variations are strictly periodic.
 |
Fig. 2 Sketch of the examined systems – spiral arm, spot, wind, and jet. The grey arrows emphasise the possibility of the extension, reduction, or replacement of the emitted regions. |
 |
Fig.xds 3 Theoretical bisector variations. Panel a: disc with a spot and orbital binary motion, panel b: disc with an oscillating spot and orbital binary motion, panel c: disc with a spiral arm, no binary motion is included, panel d: disc with a spiral arm and orbital binary motion, panel e: disc with an oscillating spiral arm. The phase ϕ denotes the angle between observer-star-spot/arm. |
3.2 The common envelope
The second set of models follow the geometry of the common envelope phase of binary evolution (Fig. 4). A spherical outflow is also taken into account in the calculations. The envelope surface is identical with the equipotential surface, containing the Lagrangian point L2. The model assumes that the emitting matter is concentrated near the orbital plane. We observe only the radiation from the surface with normal vector projection to the x axis aiming towards the observer. The parameters of the system are M1 = 7 M⊙, M2 = 1 M⊙, and the semi-major axis 6 AU.
We assumed a constant mass density of the envelope. We investigated two types of models, i) the constant temperatureand radiation density in the envelope and ii) the temperature and radiation density that decrease with r2. The model of the common envelope is able to fit an asymmetrical line profile. However, it fails to fit the bisector variations and does not explain the observed dependencies of EW on the flux and RV of the wings.
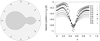 |
Fig. 4 Common envelope sketch and results of bisector modelling for i = 88° and outflow velocity of 70 km s−1. The phase ϕ denotes the angle between observer–primary–secondary. |
3.3 The wind from a cold companion in the binary
Hα profiles similar to our case are observed in spectra of some symbiotic stars, for example AG Dra (Leedjärv et al. 2004)or Z And (Tomov et al. 2007). This compels us to test the geometry of such systems (Fig. 5). The envelope is formed by the wind of the cool star. However, the location of its centre is smeared by the orbital motion. The model therefore puts the wind centre into the gravity centre of the binary. The Hα emitting disc around the hot star can also be included. The circumstellar disc is the same as in the disc case model. The stellar parameters were adopted from Zickgraf (2001) (M⋆ ~ 7 M⊙, R⋆ ~ 7.5 R⊙ and M⋆ ~ 7.5 M⊙, R⋆ ~ 100 R⊙). In order to investigate all the possible configurations that can explain the B[e] phenomenon, we also tested a case where the secondary component is a white dwarf with a mass of ~ 1 M⊙ and a radius R⋆ ~ 10−3 R⊙. The wind sphere is isothermal, and the mass density fulfils the continuity equation. The radius of the Hα emitting wind sphere is from 20 to 40 AU (~2000 times the disc radius). The semi-major axis of the system is 6 AU.
During the orbital motion, a different fraction of the circumstellar matter is occulted by the stars. The matter in the cylinder between the hot star (with the emitting disc) and the observer causes the central depression in the emission line profile. The absorption is blue-shifted with respect to the line centre because the matter in the absorbing cylinder is moving mostly towards the observer. This causes the hump also observed in the real spectrum. The peak will be therefore always red-shifted as observed. The EWs variations may be explained by changes in the absorbing cylinder optical thickness in the Hα line (and continuum) during the orbital period. The Hα emission originates in the wind sphere illuminated by the hot star radiation. The radiation density and the wind emissivity is proportional to r−2.
We adopt the β velocity law with v∞ = 100 km s−1 and the parameter β = 2∕3, which describes well a disc composed of gas and dust (Ivezić & Elitzur 2010). The cell size in the radial direction is then
 (7)
(7)
The coordinate system polar axis aims towards the observer. The step in the Θ angle is then
![Mathematical equation: \begin{equation*} {\mathrm{\Delta}} {\mathrm{\Theta}} = \arccos \left[ 1 - \left( \frac{{\mathrm{\Delta}} v}{v_{\infty}} \right)^{2} \left( 1 - \frac{R_{\star}}{r} \right)^{-2 \beta} \right]. \end{equation*}](/articles/aa/full_html/2018/09/aa32772-18/aa32772-18-eq9.png) (8)
(8)
The projection of the velocity does not vary along the φ coordinate. Therefore, the increment is fixed at the arbitrarily chosen Δ φ = 2°.
A grid of models with different physical and geometrical parameters was created. Generally, the observed bisector variations agree well with the models of a low orbital axis inclination and a radius of the wind sphere about three or four times larger then the orbital radius.
A drawback of this model, however, is that it does not explain well the EWs variations. These variations are, in this model, intrinsically bound to the variations of the emission peak (both are caused by the absorbing cylinder length variations).
 |
Fig. 5 Sketch of system described in Sect. 3.3 and theoretical bisector variations for this case. Left bottom panel: hot star (≡ white dwarf)with an accretion disc. Right bottom panel: hot star (≡ white dwarf)with an expanding disc. The phase ϕ denotes the angle between observer–primary–secondary. |
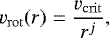
3.4 The rotating decretion disc with wind and a dusty ring
The combined ideas of the wind emission and absorption and the circumstellar disc lead to another model. This model includes a hot star with a geometrically and optically thick disc in whose outer edge the dust is present. The density in the disc is determined by the mass conservation law. The wind from the star and inner parts of the disc forms a narrow cone along the poles (Fig. 6). The system is observed under a high inclination angle. The disc is very opaque in the equatorial plane and shields itself. Only a thin stripe, which can be directly seen by the observer, is taken into account. The main contribution to the Hα emission comes from the wind parts close to the star, where an optically thin environment can be assumed. The model enables us to apply only a weak absorption in the wind. The constraints for the cell size are the same as in the previous cases.
The apex of the wind cone can be placed in the star centre or shifted below the disc plane. The position of the wind origin under the star may not correspond precisely to the physical reality. It can, however, roughly approximate a set of different physical phenomena with a simple parameter. It covers, for example, the influence of gravity darkening, limb darkening, magnetic field, or rotation, which can focus the wind more to the polar-axis direction or produce a faster wind at the pole and a slow outflow near the equator. The latter can be found for example in Curé et al. (2006).
The speed of the wind particles is approximated either by the β law (Eq. (2)) or by the relation used in the modelling of the wind from cataclysmic variables (Vitello & Shlosman 1993),
 (9)
(9)
where l is the distance from the disc along the cone and Rv is the wind acceleration scale height (a free parameter here). The power-law constant α changes in the range from 1.3 to 1.9 following Feldmeier et al. (1999). The terminal velocity v∞(V S) reaches the values of an order of 1000 km s−1. We change the wind opening angle between 5° and 10°. The density of the wind is calculated from the mass conservation equation and the wind region is assumed to be isothermal. The opening angle of the disc increases with the distance from the star. Its full opening angle at the outer edge of the disc is chosen between 40° and 80°. We set the radius of the disc at ~ 15R⋆.
Line profiles similar to those observed can be achieved if the inclination of the system is set close to 90° (~ 85°−89°; Fig. 6) and the profile asymmetry is granted by the outflow velocity in the disc and partly by the absorption in the wind. The variations of the line are caused mainly by two phenomena:
axis inclination variations (precession) or;
disc outflow velocity variations.
The inclination change causes i) a different projection of the wind velocity vector and ii) a different contribution of the disc and the emittingwind region. The different projection of the wind velocities deforms the emission line profile, especially the wings, and also changes the absorption and emission contribution of the wind. The radial velocities of the wings and EWs of the line will therefore be intrinsically bound, which is in agreement with the observation. In the model, as seen in Fig. 6, the emitting region in the wind has to be of roughly the same size as the dust ring. If it were larger, the emission of the other side of the cone would contribute significantly to the emission. This contribution would influence the correlation between the radial velocities and the EWs and observed dependencies cannot be reproduced in this case. The radiation contributing to the line peak is emitted mostly in the disc.
The result that agrees best with the observations is depicted in Fig. 7. The terminal velocity of the wind in this model is 1400 km s−1, α =1.3 (Eq. (9)), virtual wind origin is placed at 120 R⋆, and the opening angle of the wind region is 7.1°. The inner radius of the disc is 1.5 R⋆, the outer one is 15 R⋆, its full opening angle is 30°, the disc conserves the angular momentum (j = 1 in Eq. (4)), and the terminal velocity of the disc is 160 km s−1. The system is seen under a high inclination angle of 89°, whose changes are allowed in the range of ± 0.18°.
 |
Fig. 6 Sketch of disc with dust ring. The ring obscures most of the disc and a part of the wind volume. The emission arises in thevisible part of the disc and in the wind area close to the disc and star. |
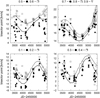 |
Fig. 7 Observed bisectors fitted by curves from disc with dust ring model (0.1 – wings, 0.9 – peak). The full line matches the bullets and the dashed line matches the squares. |
4 Discussion and conclusion
We modelled the temporal variability of the Hα bisectors, EWs, and line intensities of V2028 Cyg in order to contribute to the solution of the FS CMa paradox – the observed Ṁ (Carciofi et al. 2010) is too large to be ejected during the evolution of a single B-type star. An Ṁ of two orders of magnitude larger than the Ṁ of main-sequence B-type stars can be easily explained by the binarity of the objects. However, an insufficient number of binaries have been proved among FS CMa stars.
We chose V2028 Cyg because of the presence of hot and cold components in its spectrum, which is the strongest argument for the binarity of FS CMa stars. Our long-term systematic observations (Polster et al. 2012) allow the modelling of the variability of the Hα bisectors and EWs using a geometrical model. The comparison with our observations agrees well only for the case of a geometrically and an optically thick disc with an outer dust ring, which obscures the major part of the disc. The observed variability iscaused by the changes of the inclination angle. This finding supports the binary nature of the system even if it does not confirm the stellar origin of the K component. Conversely, the very optically thick disc seen almost edge-on supports the idea of a pseudo-atmosphere.
The presented result is the most probable but is not the only solution. The effect of the inclination angle changes is from the geometrical point of view adequate to the changes of the thickness of the dust ring. Our calculations point out the most probable geometry of the V2028 Cygni system. This is fundamental for further modelling, which must better describe thematter properties and focus on the non-LTE processes of many elements to derive more realistic Ṁ and finally resolve the FS CMa paradox.
Acknowledgements
We would like to thank the referee for his comments, which helped to improve the paper. We thank Steven N. Shore and Anatoly Miroshnichenko for their remarks and discussions. We thank colleagues at Ondřejov Observatory, Czech Republic, who helped us with observations for Paper I, on which this work is based. The research of DK is supported by grant GA 17-00871S of the Czech Science Foundation.
References
- Baines, D., Oudmaijer, R. D., Porter, J. M., & Pozzo, M. 2006, MNRAS, 367, 737 [NASA ADS] [CrossRef] [MathSciNet] [Google Scholar]
- Barsukova, E. A., Borisov, N. V., Burenkov, A. N., et al. 2006, in Stars with the B[e] Phenomenon, eds. M. Kraus, & A. S. Miroshnichenko, ASP Conf. Ser., 355, 305 [NASA ADS] [Google Scholar]
- Carciofi, A. C., Miroshnichenko, A. S., & Bjorkman, J. E. 2010, ApJ, 721, 1079 [NASA ADS] [CrossRef] [Google Scholar]
- Curé, M. 2004, ApJ, 614, 929 [NASA ADS] [CrossRef] [Google Scholar]
- Curé, M., Rial, D. F., & Cidale, L. 2006, in Stars with the B[e] Phenomenon, eds. M. Kraus, & A. S. Miroshnichenko, ASP Conf. Ser., 355, 51 [NASA ADS] [Google Scholar]
- de la Fuente, D., Najarro, F., Trombley, C., Davies, B., & Figer, D. F. 2015, A&A, 575, A10 [NASA ADS] [CrossRef] [EDP Sciences] [Google Scholar]
- Feldmeier, A., Shlosman, I., & Vitello, P. 1999, ApJ, 526, 357 [NASA ADS] [CrossRef] [Google Scholar]
- Harmanec, P. 2002, Astron. Nachr., 323, 87 [NASA ADS] [CrossRef] [Google Scholar]
- Ivezić, Ž., & Elitzur, M. 2010, MNRAS, 404, 1415 [NASA ADS] [Google Scholar]
- Jeřábková, T., Korčáková, D., Miroshnichenko, A., et al. 2016, A&A, 586, A116 [NASA ADS] [CrossRef] [EDP Sciences] [Google Scholar]
- Kučerová, B., Korčáková, D., Polster, J., et al. 2013, A&A, 554, A143 [NASA ADS] [CrossRef] [EDP Sciences] [Google Scholar]
- Lamers, H. J. G. L. M., & Cassinelli, J. P. 1999, Introduction to Stellar Winds (Cambridge: Cambridge University Press), 452 [Google Scholar]
- Lamers, H. J. G. L. M., Zickgraf, F.-J., de Winter, D., Houziaux, L., & Zorec, J. 1998, A&A, 340, 117 [NASA ADS] [Google Scholar]
- Leedjärv, L., Burmeister, M., Mikołajewski, M., et al. 2004, A&A, 415, 273 [NASA ADS] [CrossRef] [EDP Sciences] [Google Scholar]
- Meilland, A., Stee, P., Vannier, M., et al. 2007, A&A, 464, 59 [Google Scholar]
- Miroshnichenko, A. S. 2007, ApJ, 667, 497 [NASA ADS] [CrossRef] [Google Scholar]
- Miroshnichenko, A. S., & Zharikov, S. V. 2015, EAS Pub. Ser., 71, 181 [Google Scholar]
- Miroshnichenko, A. S., Bjorkman, K. S., Chentsov, E. L., et al. 2002, A&A, 388, 563 [NASA ADS] [CrossRef] [EDP Sciences] [Google Scholar]
- Miroshnichenko, A. S., Manset, N., Kusakin, A. V., et al. 2007, ApJ, 671, 828 [NASA ADS] [CrossRef] [Google Scholar]
- Miroshnichenko, A. S., Zharikov, S. V., Danford, S., et al. 2015, ApJ, 809, 129 [NASA ADS] [CrossRef] [Google Scholar]
- Polster, J., Korčáková, D., Votruba, V., et al. 2012, A&A, 542, A57 [NASA ADS] [CrossRef] [EDP Sciences] [Google Scholar]
- Tomov, N. A., Tomova, M. T., & Bisikalo, D. V. 2007, MNRAS, 376, L16 [NASA ADS] [CrossRef] [Google Scholar]
- Vitello, P., & Shlosman, I. 1993, ApJ, 410, 815 [NASA ADS] [CrossRef] [Google Scholar]
- Zickgraf, F.-J. 2001, A&A, 375, 122 [NASA ADS] [CrossRef] [EDP Sciences] [Google Scholar]
All Figures
|
Fig. 1 Hα profile of V2028 Cyg obtained with the Ondřejov 2 m telescope (R ~ 12 500) on 24 May 2005. The line bisector is plotted by the solid grey line and its values at different levels used for comparison of the model and observations are depicted by the black crosses. |
| In the text | |
|
Fig. 2 Sketch of the examined systems – spiral arm, spot, wind, and jet. The grey arrows emphasise the possibility of the extension, reduction, or replacement of the emitted regions. |
| In the text | |
|
Fig.xds 3 Theoretical bisector variations. Panel a: disc with a spot and orbital binary motion, panel b: disc with an oscillating spot and orbital binary motion, panel c: disc with a spiral arm, no binary motion is included, panel d: disc with a spiral arm and orbital binary motion, panel e: disc with an oscillating spiral arm. The phase ϕ denotes the angle between observer-star-spot/arm. |
| In the text | |
|
Fig. 4 Common envelope sketch and results of bisector modelling for i = 88° and outflow velocity of 70 km s−1. The phase ϕ denotes the angle between observer–primary–secondary. |
| In the text | |
|
Fig. 5 Sketch of system described in Sect. 3.3 and theoretical bisector variations for this case. Left bottom panel: hot star (≡ white dwarf)with an accretion disc. Right bottom panel: hot star (≡ white dwarf)with an expanding disc. The phase ϕ denotes the angle between observer–primary–secondary. |
| In the text | |
|
Fig. 6 Sketch of disc with dust ring. The ring obscures most of the disc and a part of the wind volume. The emission arises in thevisible part of the disc and in the wind area close to the disc and star. |
| In the text | |
|
Fig. 7 Observed bisectors fitted by curves from disc with dust ring model (0.1 – wings, 0.9 – peak). The full line matches the bullets and the dashed line matches the squares. |
| In the text | |
Current usage metrics show cumulative count of Article Views (full-text article views including HTML views, PDF and ePub downloads, according to the available data) and Abstracts Views on Vision4Press platform.
Data correspond to usage on the plateform after 2015. The current usage metrics is available 48-96 hours after online publication and is updated daily on week days.
Initial download of the metrics may take a while.