Free Access
Fig. 9.
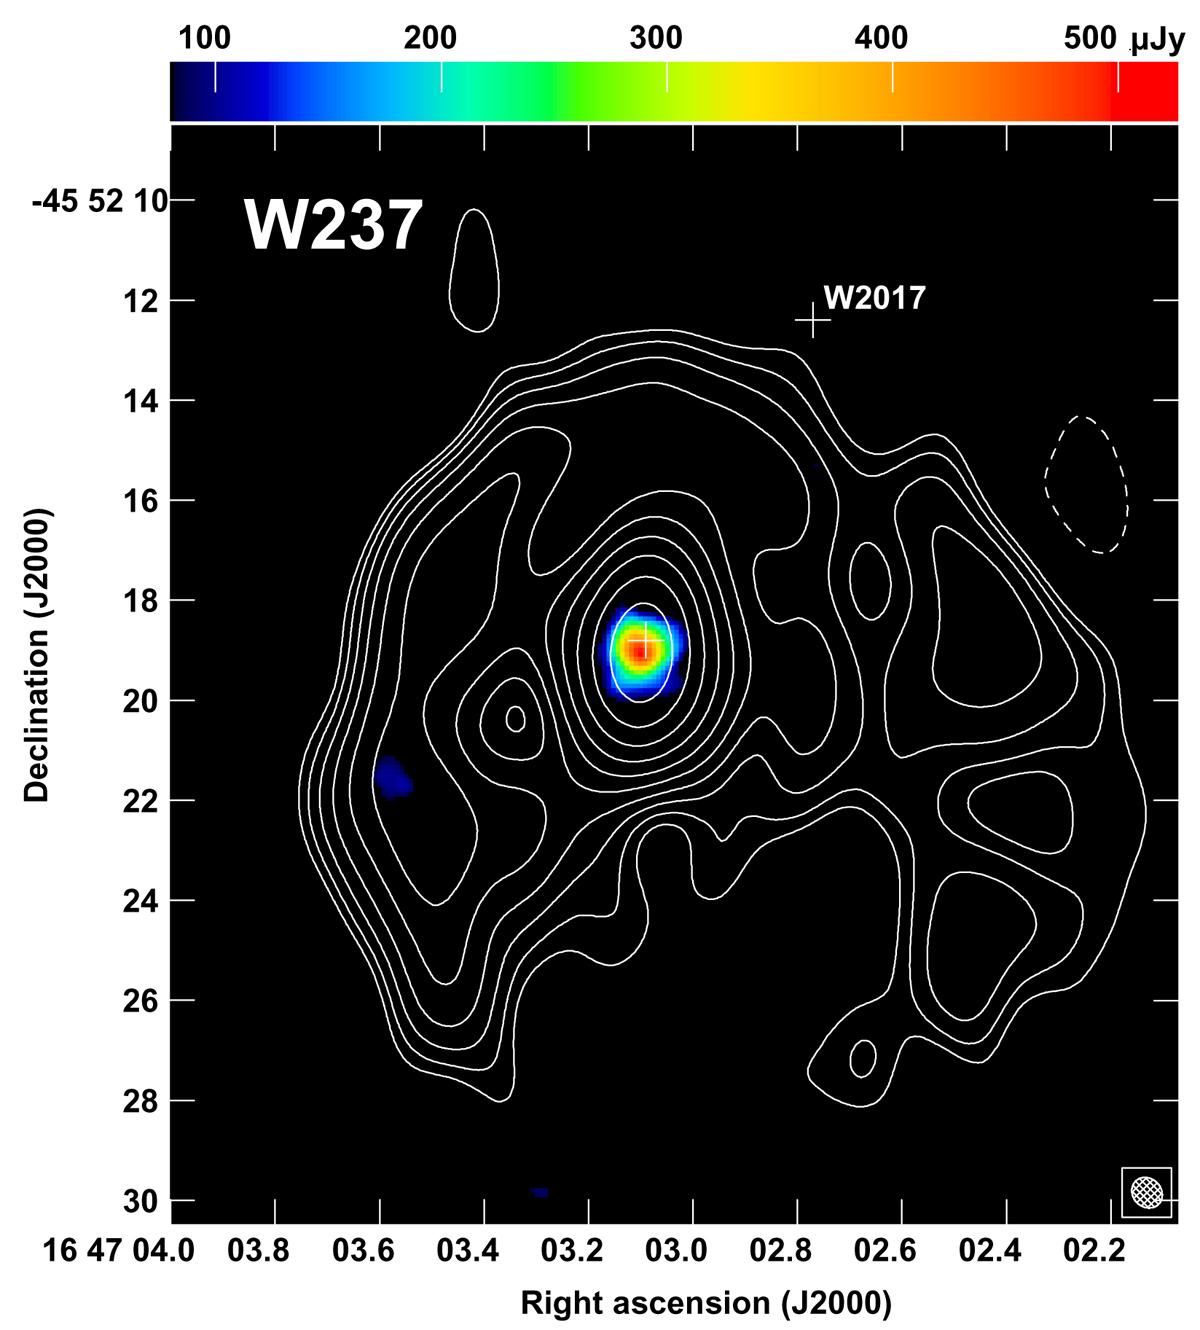
ALMA image of the red supergiant Wd1-237. The contours are from recent 8.6 GHz ATCA observations of Wd1 (see Andrews et al. 2018, for more details) and are plotted at −1, 1, 1.41, 2, 2.83, 4, 5.66, 8, 11.31, 16 × 58 μ Jy beam−1.
Current usage metrics show cumulative count of Article Views (full-text article views including HTML views, PDF and ePub downloads, according to the available data) and Abstracts Views on Vision4Press platform.
Data correspond to usage on the plateform after 2015. The current usage metrics is available 48-96 hours after online publication and is updated daily on week days.
Initial download of the metrics may take a while.