Free Access
Fig. 7.
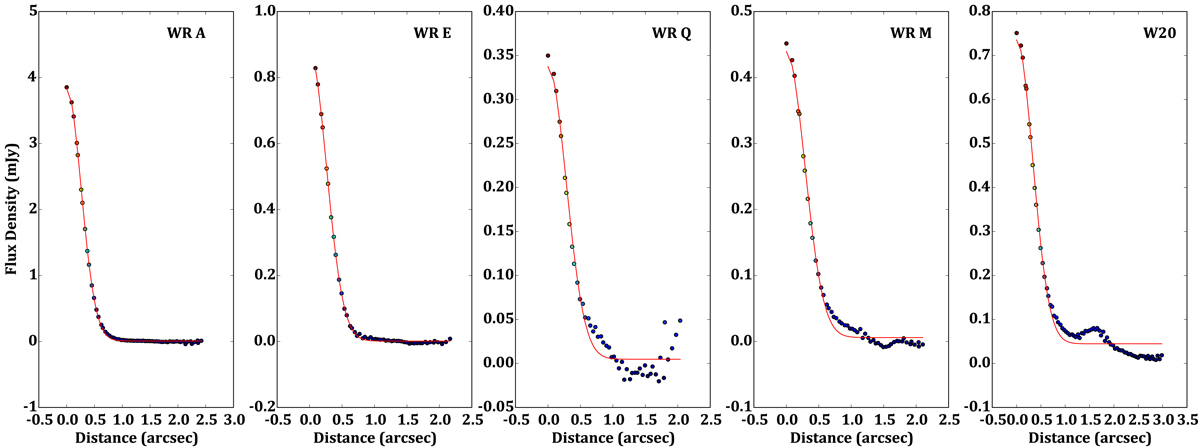
Integrated annular profiles for five sources in Wd1. The deviation from a smooth Gaussian profile can be seen for sources WR M and Q, whilst none is visible for sources WR A and E. Wd1-20 shows a clear deviation from a Gaussian courtesy of low surface-brightness emission surrounding the compact core.
Current usage metrics show cumulative count of Article Views (full-text article views including HTML views, PDF and ePub downloads, according to the available data) and Abstracts Views on Vision4Press platform.
Data correspond to usage on the plateform after 2015. The current usage metrics is available 48-96 hours after online publication and is updated daily on week days.
Initial download of the metrics may take a while.