Fig. 6.
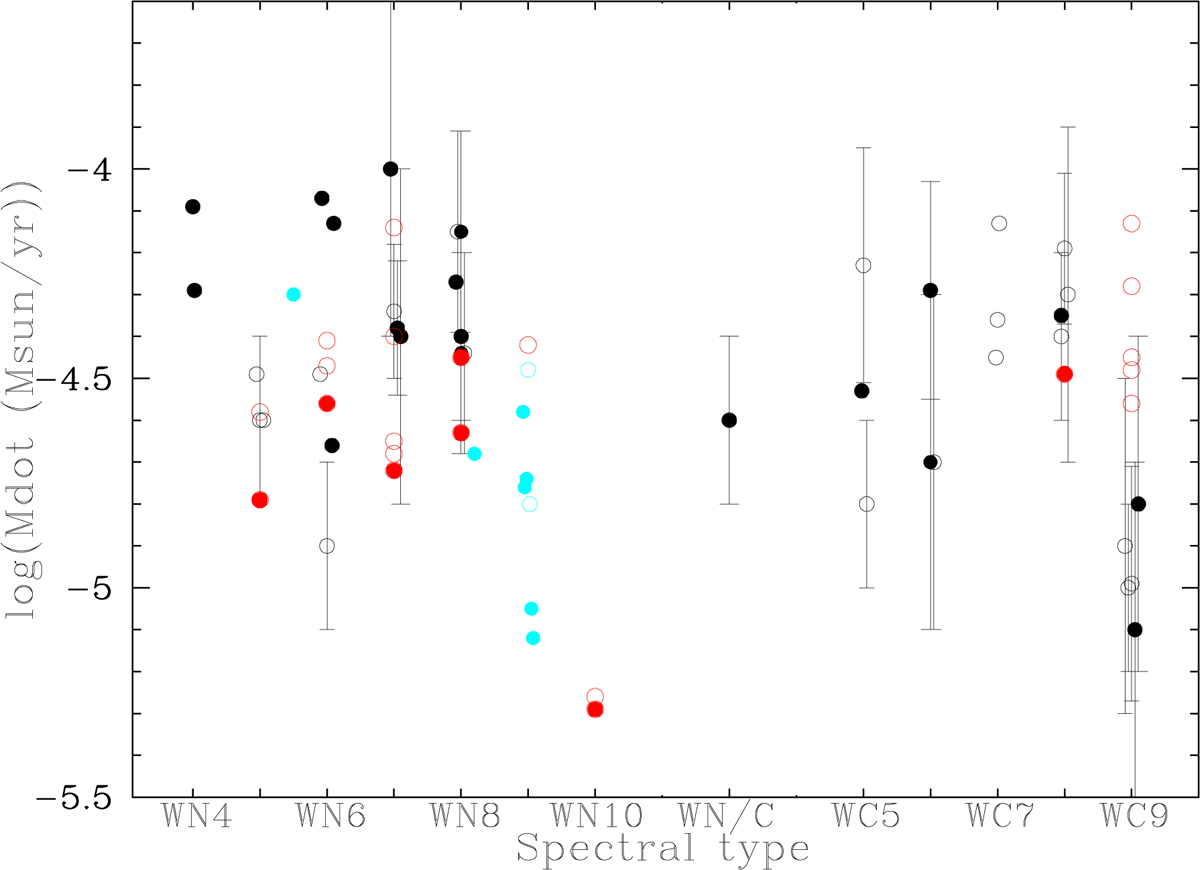
Plot of 3-mm mass-loss rate versus spectral sub-type for the WRs within Wd1 (red; open (filled) symbols corresponding to apparent binary (single) stars). Comparable mass-loss rates derived via radio observations of field stars are also presented (symbols in black as before; data from Willis 1991; Leitherer et al. 1997 and Cappa et al. 2004). Values for members of the Galactic Centre cluster are given in blue (Yusef-Zadeh et al. 2017). Error-bars are plotted where given in the source material. 3-mm error-bars for Wd1 stars have not been included for clarity but are estimated to be ±0.2 dex; please see the text in Sect. 4.2.2 for further details. Note in some instances a slight offset parallel to the x-axis from the spectral-type marker has been applied for reasons of clarity.
Current usage metrics show cumulative count of Article Views (full-text article views including HTML views, PDF and ePub downloads, according to the available data) and Abstracts Views on Vision4Press platform.
Data correspond to usage on the plateform after 2015. The current usage metrics is available 48-96 hours after online publication and is updated daily on week days.
Initial download of the metrics may take a while.