Fig. 13.
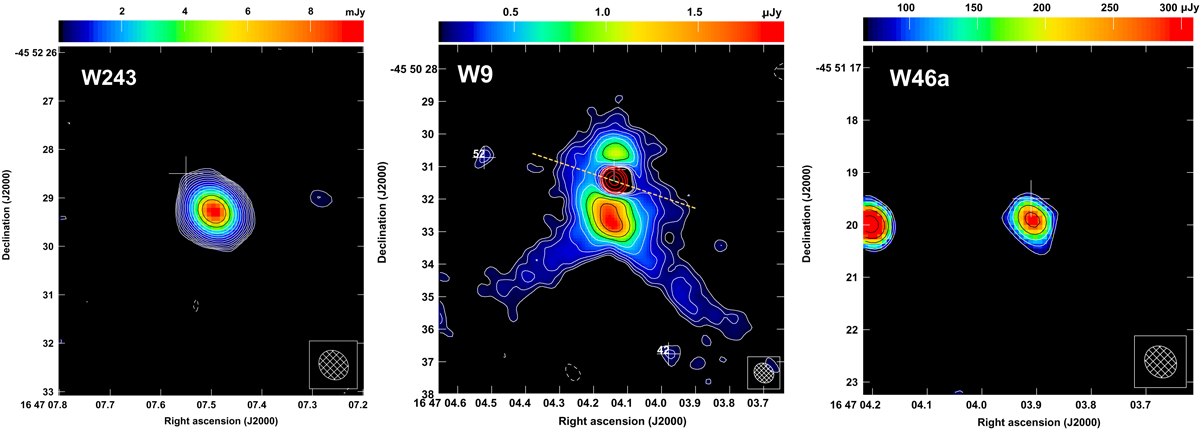
ALMA images of the LBV Wd1-243 (left), the SgB[e] star Wd1-9 (middle) and the B1 supergiant Wd1-46a (right). For Wd1-243 and Wd1-46a contours are plotted at −1, 1, 1.41, 2, 2.83, 4, 5.66, 8, 11.31, 16 × 3σ where σ is 30 μ Jy beam−1. For Wd1-9 the larger white contours are plotted as for Wd1-243 and −46a with a σ of 33 μ Jy beam−1. The red contours show the bright compact source emission and are plotted at levels of 41.4, 58.0, 82.3 and 116.4 mJy beam−1. The dashed line bi-secting the central compact source in Wd1-9 reflects the orientation of the apparent bipolar outflow reported in Fenech et al. (2017).
Current usage metrics show cumulative count of Article Views (full-text article views including HTML views, PDF and ePub downloads, according to the available data) and Abstracts Views on Vision4Press platform.
Data correspond to usage on the plateform after 2015. The current usage metrics is available 48-96 hours after online publication and is updated daily on week days.
Initial download of the metrics may take a while.