Fig. 12.
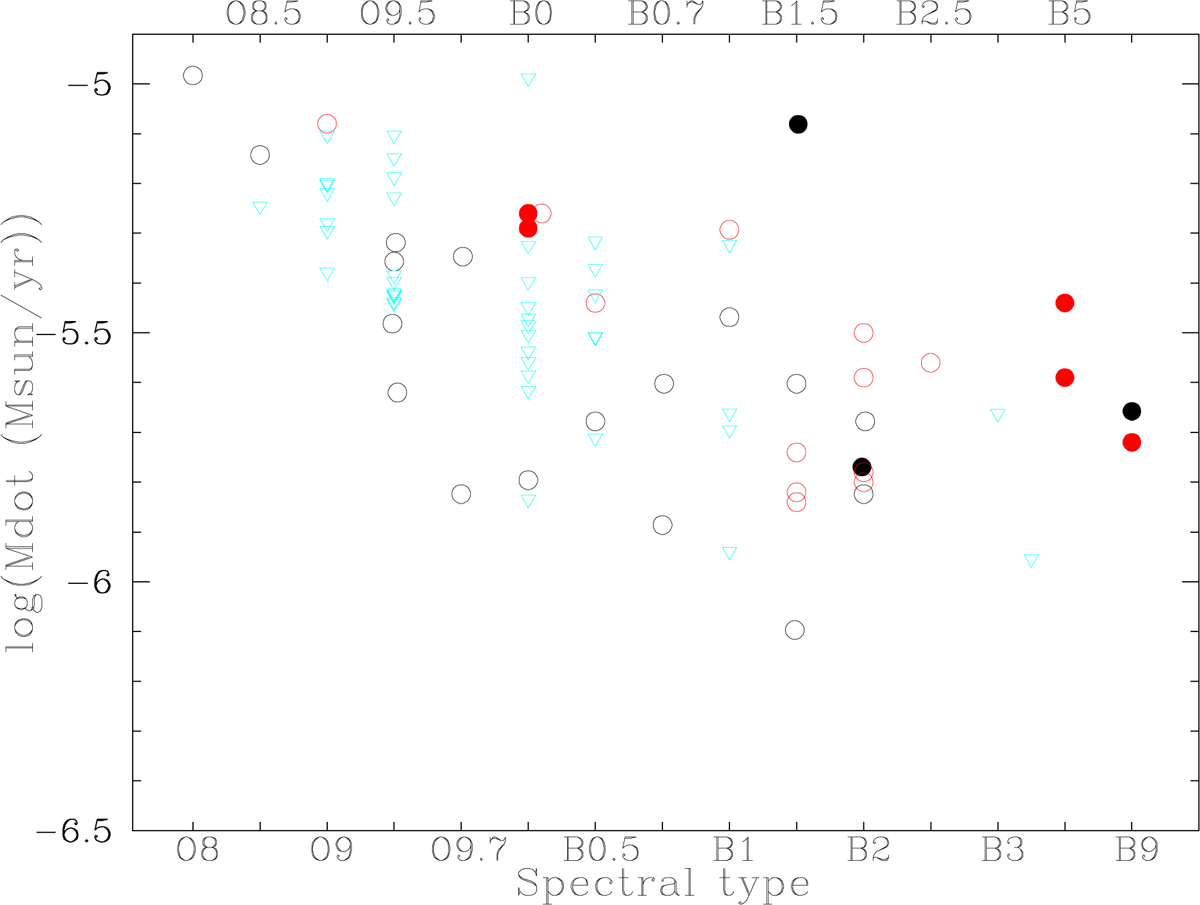
Plot of mass-loss rate versus spectral type for the population of OB super- (red, open symbols) and hyper-giants (red, filled symbols) within Wd1. Upper limits are given by the inverted blue triangles. Comparable mass-loss rates derived via radio observations of field stars are also presented (symbols in black as before; data from Benaglia et al. 2007; Leitherer et al. 1995). With a (variable) mass-loss rate of log(Ṁ/M⊙ (yr−1)) ~ −4.89 → −4.74, Cyg OB2 #12 (B3-4 Ia+) lies outside this plot, while the isolated point corresponds to the highly luminous BHG ζ1 Sco. Error bars are not included for clarity, however representative errors are 0.1–0.2 dex for this work, and around 0.2 dex for values taken from Benaglia et al. (2007) and Leitherer et al. (1995).
Current usage metrics show cumulative count of Article Views (full-text article views including HTML views, PDF and ePub downloads, according to the available data) and Abstracts Views on Vision4Press platform.
Data correspond to usage on the plateform after 2015. The current usage metrics is available 48-96 hours after online publication and is updated daily on week days.
Initial download of the metrics may take a while.