Fig. 11.
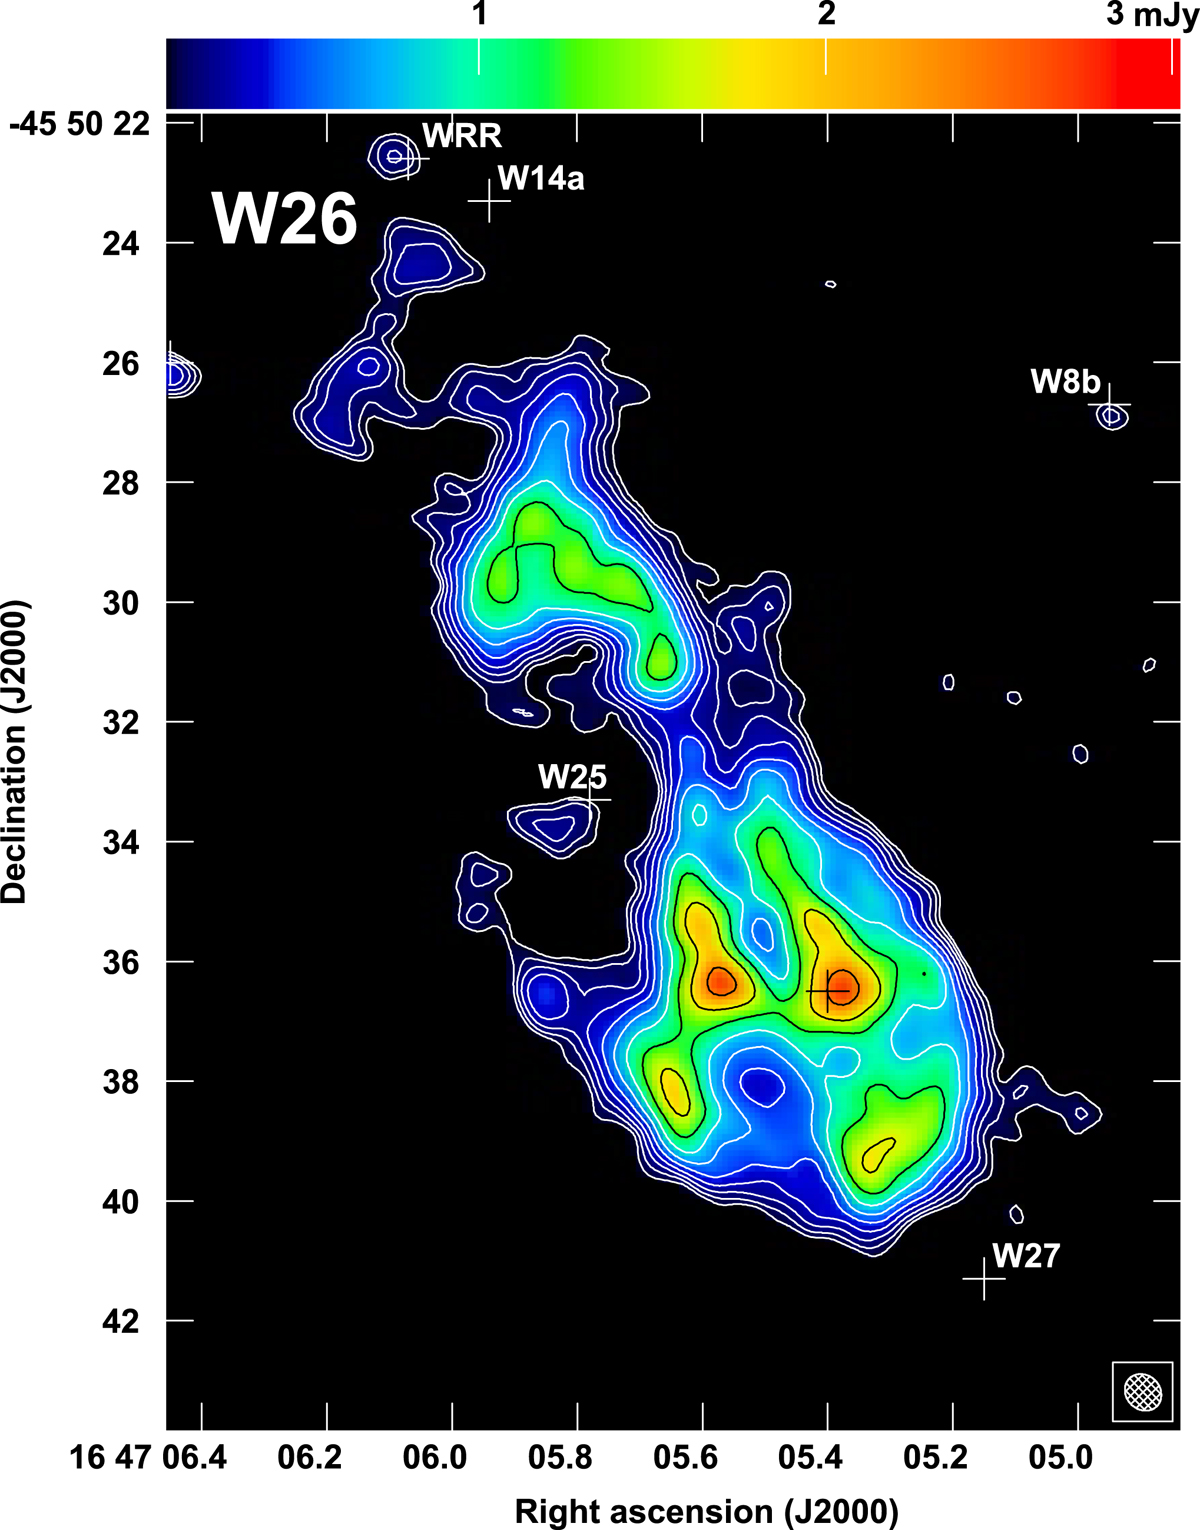
ALMA image of the red supergiant star Wd1-26 shown in colour-scale. Contours are plotted at −1, 1, 1.41, 2, 2.83, 4, 5.66, 8, 11.31, 16 × 3σ where σ is 64 μ Jy beam−1. See Appendix B for further images of W26 comparing the mm emission with that seen in the 8.6 GHz radio emission from Do10 and the Hα images presented by Wright et al. (2014).
Current usage metrics show cumulative count of Article Views (full-text article views including HTML views, PDF and ePub downloads, according to the available data) and Abstracts Views on Vision4Press platform.
Data correspond to usage on the plateform after 2015. The current usage metrics is available 48-96 hours after online publication and is updated daily on week days.
Initial download of the metrics may take a while.