Fig. 7.
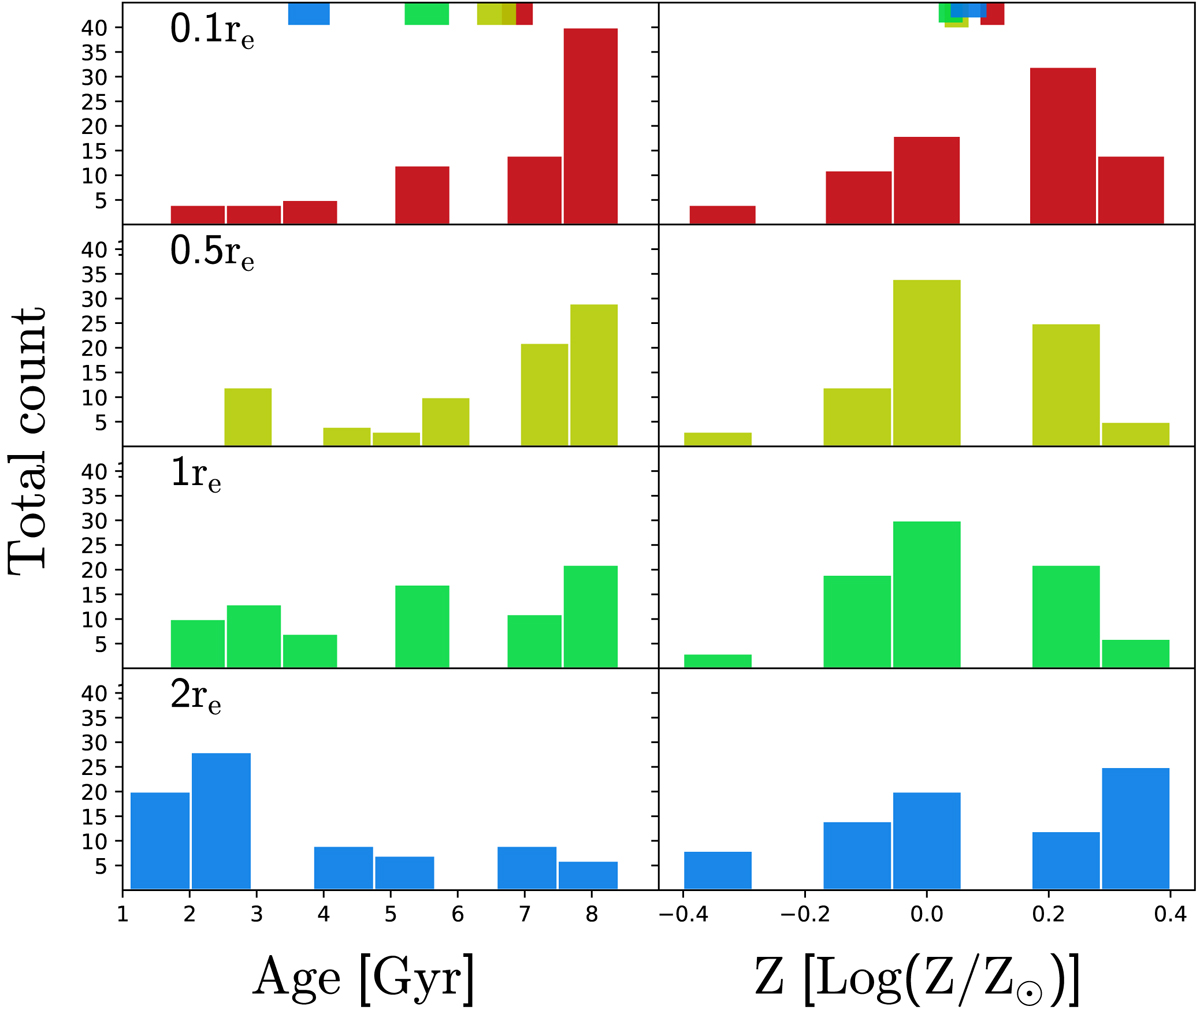
Left panels from top to bottom: age distributions from 0.1re to 2re. Analogously, the right panels show the metallicity distributions. The color scheme is the same as in Fig. 6. The rectangles at the top display the average values, and the widths correspond to the respective errors. For our sample galaxies we detect on average a negative metallicity gradient (i.e., higher metallicities in the centers) and a clear negative age gradient (i.e., older stars in the central regions).
Current usage metrics show cumulative count of Article Views (full-text article views including HTML views, PDF and ePub downloads, according to the available data) and Abstracts Views on Vision4Press platform.
Data correspond to usage on the plateform after 2015. The current usage metrics is available 48-96 hours after online publication and is updated daily on week days.
Initial download of the metrics may take a while.