Fig. 6.
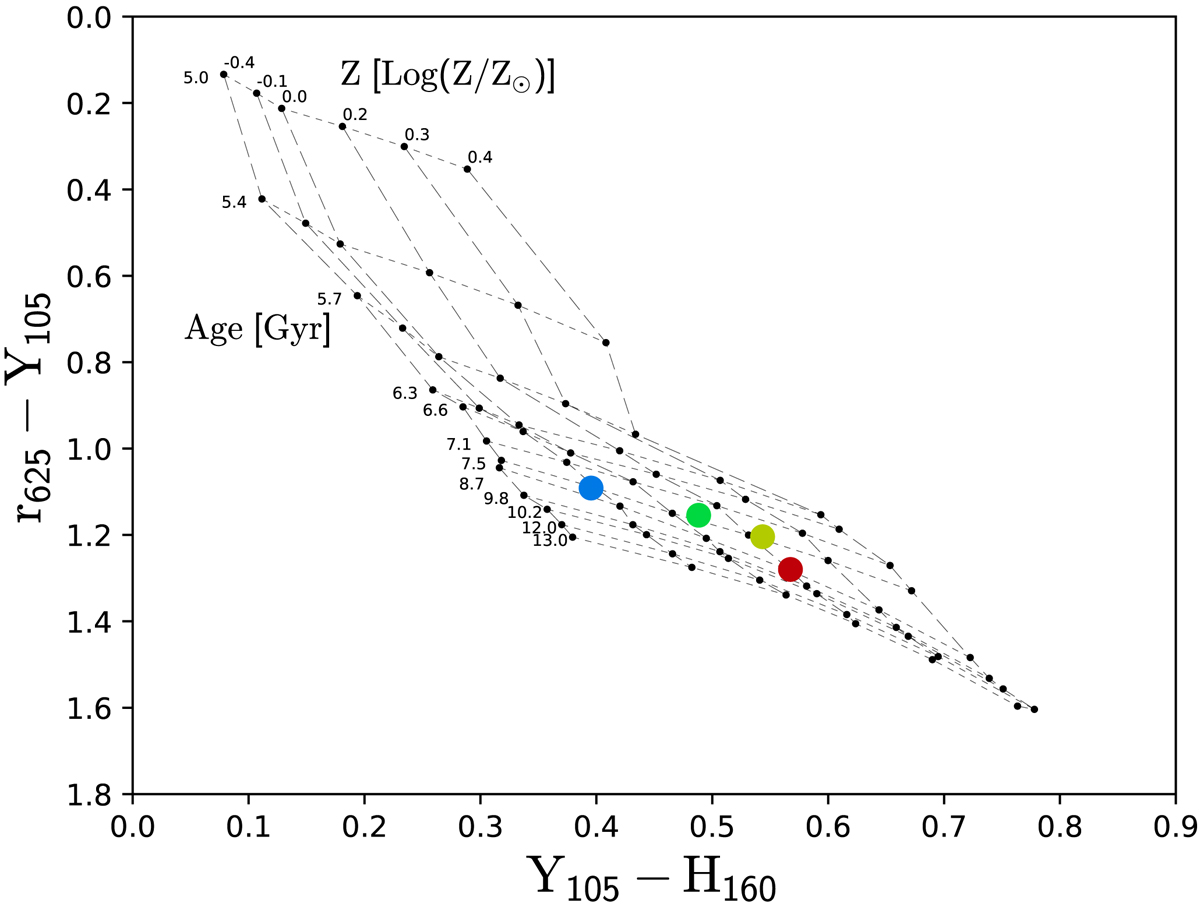
Color-color diagram for one of the early-type cluster galaxies in our sample. The red dot represents the color values at 0.1re, the yellow dot shows the color values at 0.5re, the green dot plots the color values at 1re, and finally, the blue dot shows color values at 2re. r625 − Y105 is more sensitive to age variations, but Y105 − H160 traces the metallicity. For this galaxy the innermost region between 0.1re and 0.5re is clearly age dominated, while at larger radii, a trend with metallicity takes over.
Current usage metrics show cumulative count of Article Views (full-text article views including HTML views, PDF and ePub downloads, according to the available data) and Abstracts Views on Vision4Press platform.
Data correspond to usage on the plateform after 2015. The current usage metrics is available 48-96 hours after online publication and is updated daily on week days.
Initial download of the metrics may take a while.