Fig. 4.
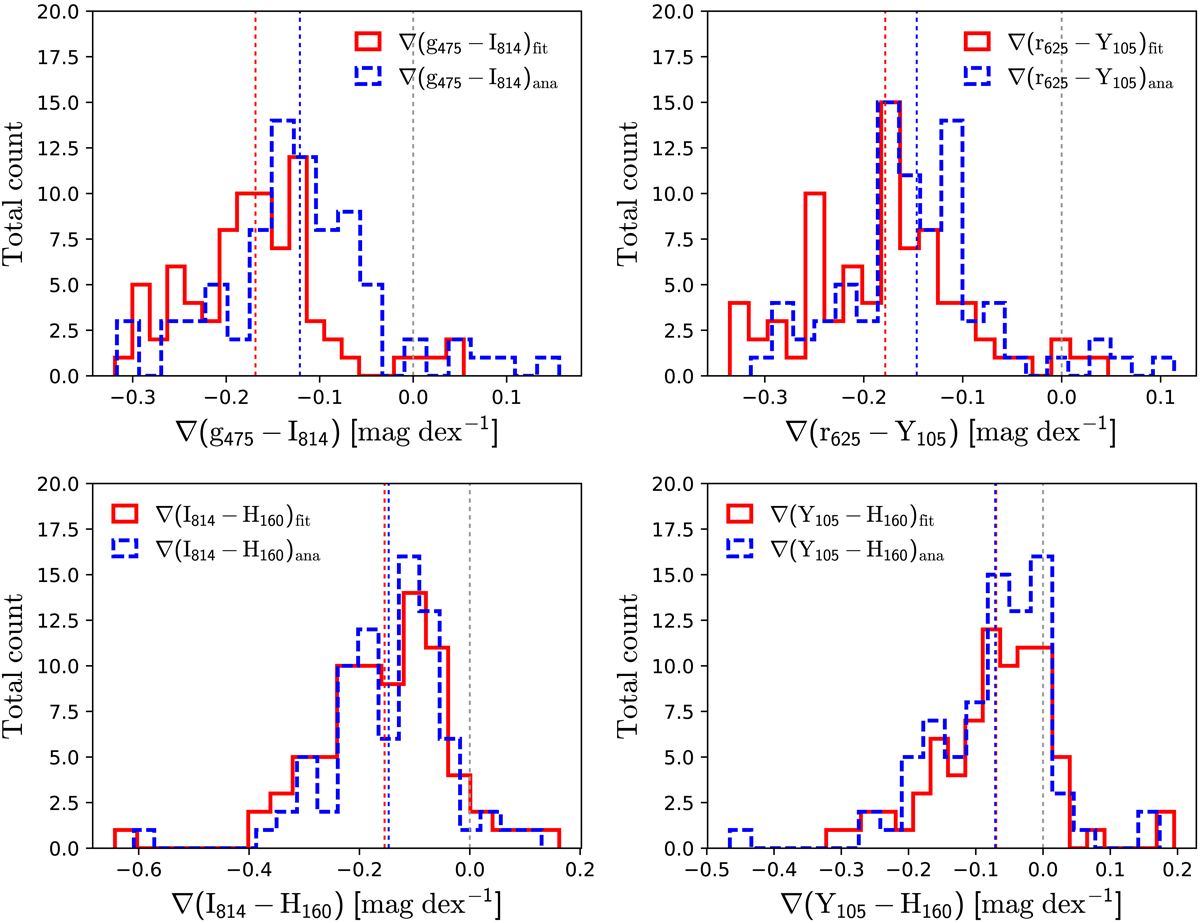
Distributions of the color gradients for the four colors. Red bars indicate the color gradients assessed by fitting to the color profile, blue bars display the analytically derived gradients. The corresponding dashed lines denotes the respective means, and the gray dotted line indicates a color gradient ∇(λ1−λ2) = 0. For all four colors and independent of method, we derive negative mean color gradients.
Current usage metrics show cumulative count of Article Views (full-text article views including HTML views, PDF and ePub downloads, according to the available data) and Abstracts Views on Vision4Press platform.
Data correspond to usage on the plateform after 2015. The current usage metrics is available 48-96 hours after online publication and is updated daily on week days.
Initial download of the metrics may take a while.