Fig. 3.
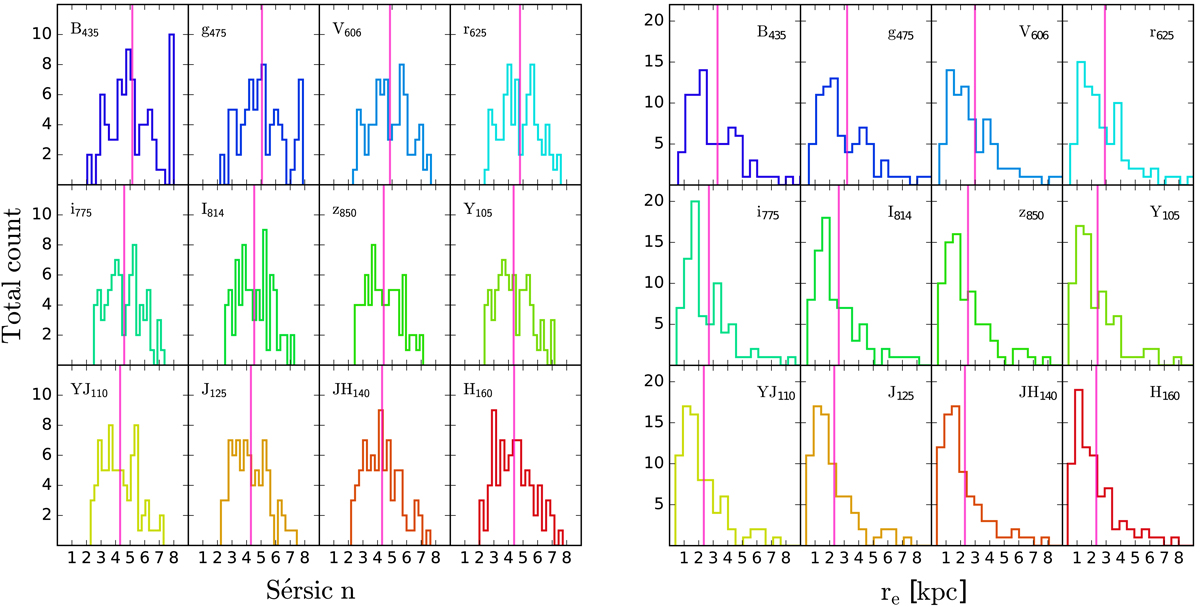
Left side: distribution of Sérsic index n in the 12 bands for the 79 galaxies contained in the final sample. The magenta line shows the respective mean, and the filter name is given in each panel. In all 12 bands our mean Sérsic indices show typical values for early-type galaxies. Right side: analogously to the left side, the distributions for the effective radius re are shown. A clear trend to smaller sizes with increasing wavelength is visible.
Current usage metrics show cumulative count of Article Views (full-text article views including HTML views, PDF and ePub downloads, according to the available data) and Abstracts Views on Vision4Press platform.
Data correspond to usage on the plateform after 2015. The current usage metrics is available 48-96 hours after online publication and is updated daily on week days.
Initial download of the metrics may take a while.