Fig. A.1
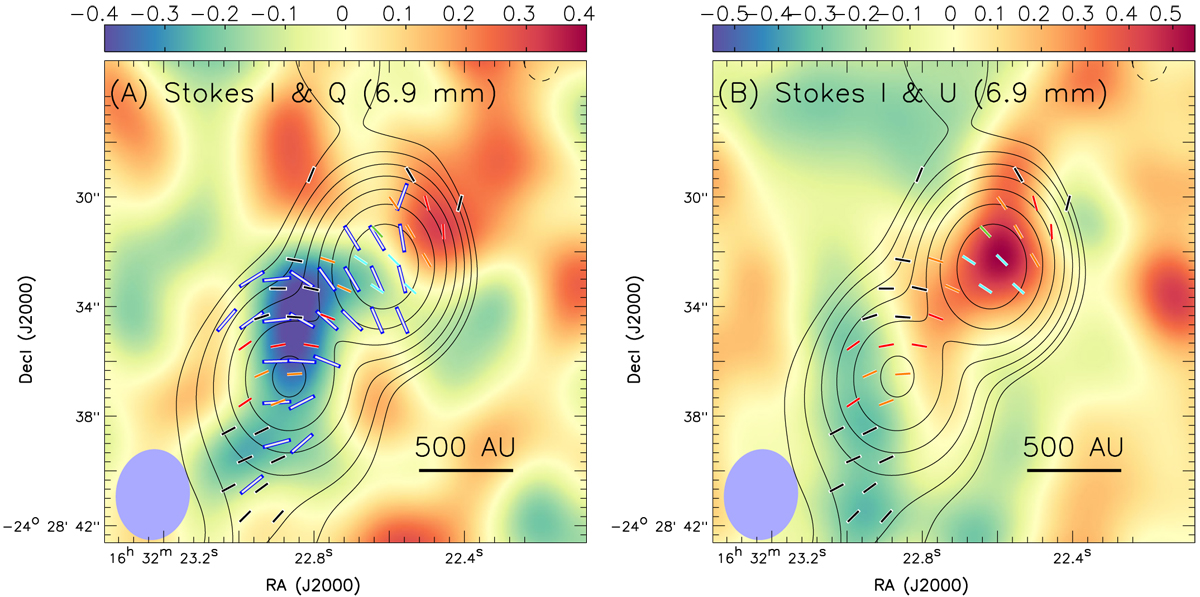
Tapered JVLA 40–48 GHz continuum images of IRAS 16293–2422. The synthesized beam [θmaj × θmin = 3.′′ 3 × 2.′′ 6 (P.A. = –5.8°)] is shown in at bottom left. Contours present the Stokes I intensity. The Stokes Q and U dirty (i.e., not cleaned) images are presented in colors in panels a and b, respectively. Contours are 0.09 mJy beam−1 (1σ, ~0.0066 K) × [3, 6, 12, 24, 48, 96, 192]. Color bars are in mJy beam−1 units. Line segments are similar to those presented in Fig. 1, although we caution that the polarization position angles and percentages derived from Stokes Q and U dirty images are largely uncertain. In addition, in panel a, the SMA measurements at 341.5 GHz quoted from Table 4 of Rao et al. (2009) are overplotted as gray line segments which are bounded by blue lines. The baseline range covered by these SMA observations is 7–70 m, which corresponds to the uv distance range of 8–80 kλ.
Current usage metrics show cumulative count of Article Views (full-text article views including HTML views, PDF and ePub downloads, according to the available data) and Abstracts Views on Vision4Press platform.
Data correspond to usage on the plateform after 2015. The current usage metrics is available 48-96 hours after online publication and is updated daily on week days.
Initial download of the metrics may take a while.